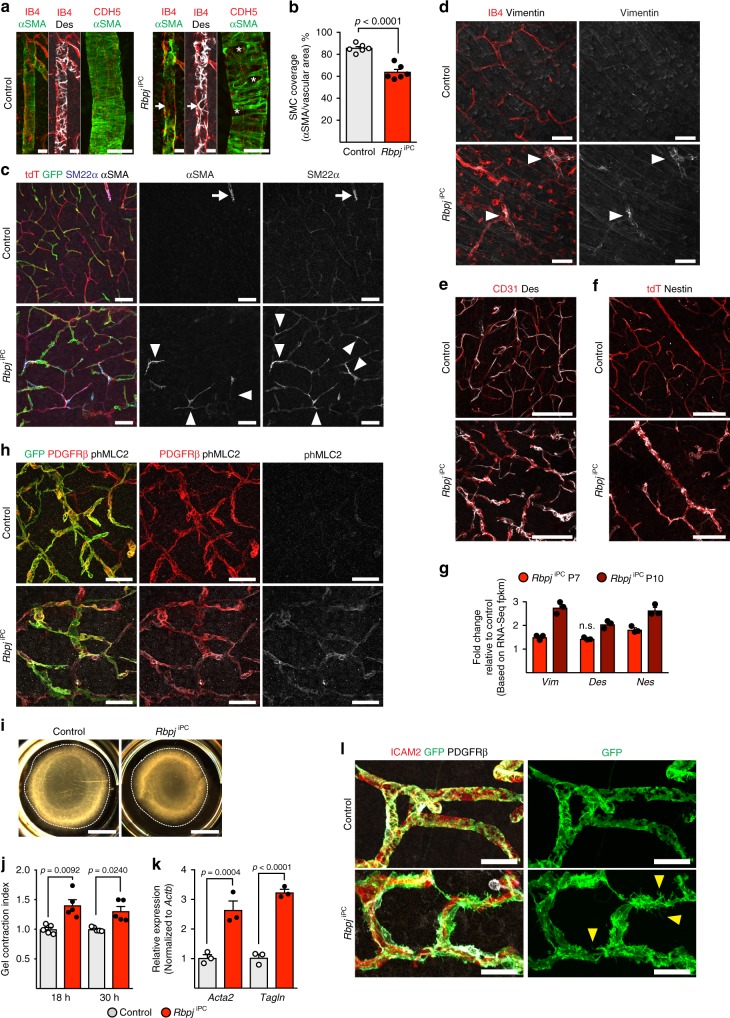
Fig. 4.
Functional defects of Rbpj mutant mural cells. a Confocal images of P10 cortical arteries stained for isolectin B4 (IB4) or CDH5 (red), αSMA (green), and Desmin (Des, white). Note irregular SMC coverage of mutant arteries (asterisk) and lack of αSMA labelling in Des+ regions (white arrow). Scale bar, 50 μm (left panels) and 25 μm (right panel, high magnification). b SMC coverage in P10 brain cortex arteries. p-values, Student’s t-test, n = 6. c Confocal images of P10 cortical vasculature (tdT+, red) stained for GFP (green), SM22α (blue, white), and αSMA (white). Note the expression of αSMA and SM22α in the RbpjiPC microvasculature (white arrowheads). Scale bar, 100 μm. d–f Confocal images of brain cortex vasculature showing increased mural cell-specific staining of Vimentin (d, arrowheads), Desmin (Des, e), and Nestin (f) (all in white) in P10 RbpjiPC blood vessels (labelled with IB4, CD31, or tdT, red) relative to control. Scale bar, 50 μm (d) or 100 μm (e, f). g Gene expression fold change (RNA-seq fpkm) in RbpjiPC mutants relative to age-matched controls (set as 1). p-adjusted values < 0.0001 for all with exception of Des expression at P7. n = 3. n.s., not statistically significant. h Confocal images of P10 cortical blood vessels showing increased immunostaining for phospho-myosin light chain 2 (phMLC2, white) in pericytes (PDGFRβ+, red; GFP+, green). Scale bar, 50 μm. i Collagen gel contraction assay showing increased contractile ability of lentivirus-Cre transfected RbpjiPC relative to control primary mouse brain pericytes. Scale bar, 4 mm. j Contractility quantitation at 18 and 30 h after pericyte seeding. p-values, Kruskal–Wallis with Dunn’s test, n = 5. k RT-qPCR analysis of Acta2 and Tagln expression in cultured pericytes. p-values, one-way ANOVA with Sidak’s test, n = 3. l Confocal images of P10 brain cortex microvasculature stained for ICAM2 (red), GFP (green), and PDGFRβ (white). Cre-induced membrane-tagged GFP expression allows detailed imaging of abnormal protrusions emerging from RbpjiPC pericytes (yellow arrowheads). Scale bar, 25 μm. Error bars represent s.e.m. Source data are provided as a Source Data file

