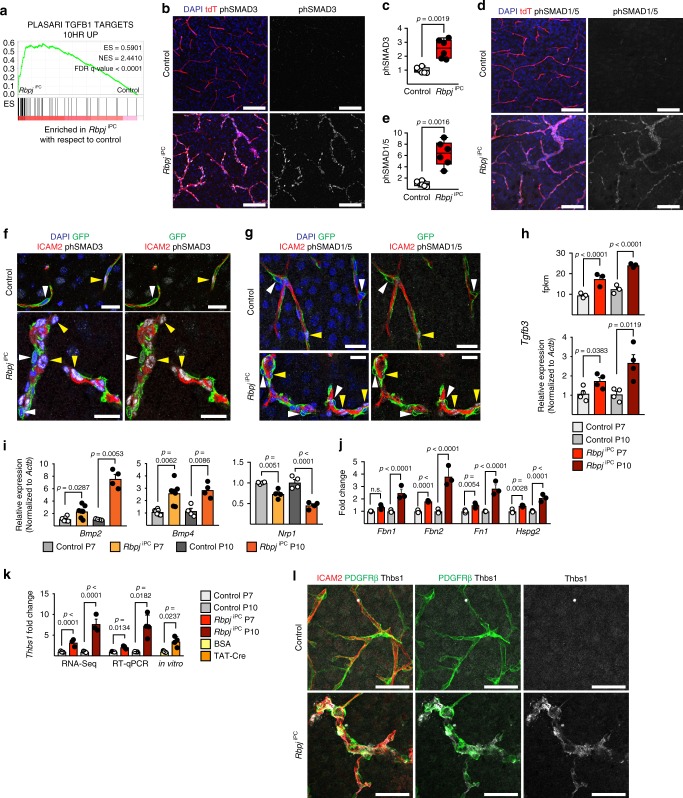
Fig. 5.
Increased TGFβ signalling in the RbpjiPC cerebral vasculature. a GSEA of overexpressed genes (RNA-seq model-based clustering analysis) reveals upregulation of TGFβ targets in RbpjiPC. ES, enrichment score; NES, normalized enrichment score; FDR, false discovery rate. b Confocal images showing increased phosphorylation of SMAD3 (phSMAD3, white) in P10 RbpjiPC brain cortex vasculature (tdT+, red). Scale bar, 100 μm. c phSMAD3 immunosignal intensity quantitation in P10 brain vasculature. p-values, Welch’s t-test, n = 6. d Confocal images showing increased phosphorylation of SMAD1/5 (phSMAD1/5, white) in P10 RbpjiPC brain cortex vasculature (tdT+, red). Scale bar, 100 μm. e phSMAD1/5 immunosignal intensity quantitation in P10 brain vasculature. p-values, Welch’s t-test, n = 6. f, g Confocal single optical sections showing localization of phSMAD3 (f) or phSMAD1/5 (g) (white) in the nuclei (DAPI+, blue) of ECs (ICAM2+, red; yellow arrowheads) or pericytes (GFP+, green; white arrowheads) in P10 cortical vessels. Note phSMAD3 presence in ECs and pericytes, while phSMAD1/5 is only detectable in ECs. Scale bar, 25 μm. h Tgfb3 expression in cortical mural cells from P7 or P10 mice analyzed by RNA-seq (top) or RT-qPCR (bottom). p-adjusted values (RNA-seq) or p-values, Student’s t-test, n = 3–4. i RT-qPCR analysis in sorted ECs from P7 and P10 brain cortices. p-values, Brown–Forsythe and Welch one-way ANOVA with Tamhane’s T2 test (Bmp2 and Bmp4), or one-way ANOVA with Sidak’s (Nrp1), n = 4–7. j Gene expression fold change based on RNA-seq counts in P7 and P10 brain cortex mural cells. p-adjusted values. n = 3. k Thrombospondin-1 (Thbs1) expression analysis in vivo (RNA-seq and RT-qPCR for FACS-sorted mural cells) and in vitro in cultured pericytes. p-adjusted values (RNA-seq), p-values, Welch’s t-test (in vitro), or Brown–Forsythe and Welch one-way ANOVA with Holm–Sidak’s test (RT-qPCR), n = 3–4. l Confocal images showing increased expression of thrombospondin-1 (Thbs1, white) in mural cells (PDGFRβ+, green) of P10 RbpjiPC cortical vasculature (ICAM2+, red). Scale bar, 50 μm. Error bars represent s.e.m. Source data are provided as a Source Data file

