Fig. 7.
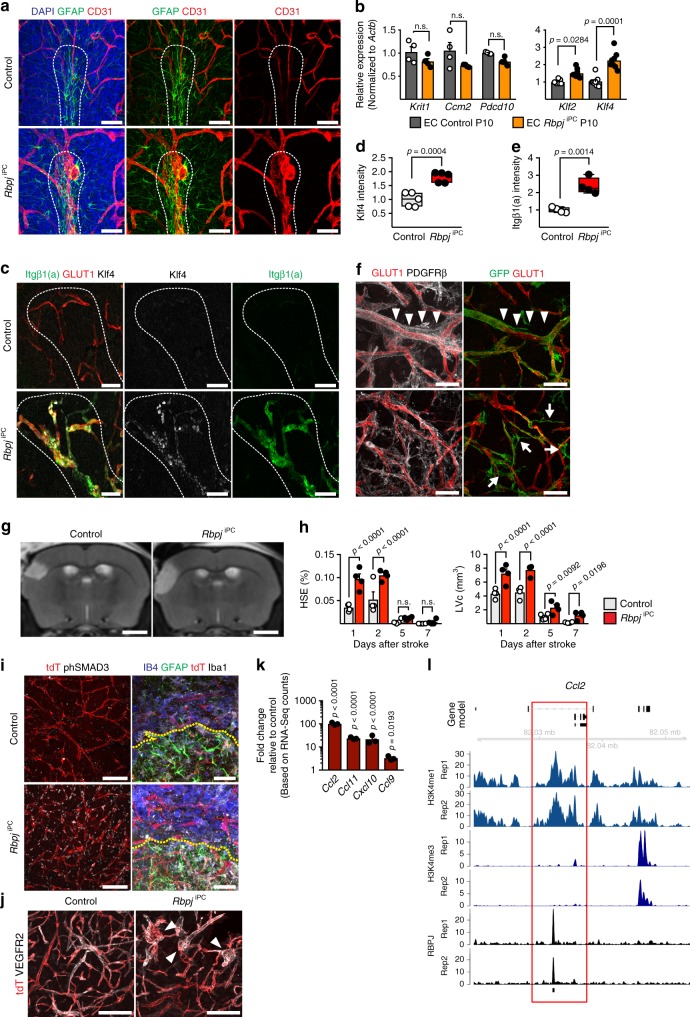
Molecular similarities with CCMs and impact of Rbpj deletion in stroke. a Confocal images of cerebellar white matter (dashed outline) in P10 brains. Note dilated vessels (CD31+, red) and gliosis (GFAP+, green) in mutants. Scale bar, 50 μm. b RT-qPCR analysis in P10 sorted brain ECs. p-values, Brown–Forsythe and Welch one-way ANOVA with Tamhane’s T2 test (Krit1, Ccm2, and Pdcd10), and Kruskal–Wallis with Dunn’s test (Klf2 and Kl4), n = 4. c Confocal images showing Klf4 (white) and active integrin-β1 (Itgβ1(a), green) in blood vessels (GLUT1+, red) of P10 RbpjiPC cerebellar white matter (dashed outline). Scale bar, 50 μm. d, e Klf4 (d) and active integrin-β1 (e) immunosignal fold change intensity in P10 vasculature. p-values, Student’s t-test, n = 5. f Confocal images showing perivascular PDGFRβ (white) expression after stroke. Note abundance of PDGFRβ+ GFP− cells (arrowheads, top panel) and morphological changes in GFP+ pericytes (arrows, bottom panel). Scale bar, 50 μm. g Representative T2-weight magnetic resonance imaging (MRI) 1 day after stroke. Scale bar, 2 mm. h MRI-based quantitation of space-occupying effect attributable to oedema (% HSE) and the lesion volume corrected (LVc, mm3) after stroke. FDR-adjusted p-values, one-way ANOVA with two stage linear step-up procedure of Benjamini, Krieger, and Yekutieli multiple comparison correction, n = 4. i Confocal images showing increased phSMAD3 (white; left panel) and infiltration of inflammatory cells (IB4+, blue; Iba1+, white; right panel) in RbpjiPC brains after stroke. GFAP staining (green, right panel) indicates boundary between infarct zone and penumbra (dashed line). Vessels are labelled by tdT (red). Scale bar, 100 μm (left) and 50 μm (right). j Confocal images showing blood vessel (tdT, red; VEGFR2, white) defects (arrowheads) in RbpjiPC mice 7 days post-stroke. Scale bar, 100 μm. k Gene expression fold change of pro-inflammatory chemokines in P10 RbpjiPC mural cells relative to controls (set as 1). p-adjusted values. n = 3. l RBPJ binding and H3K4me, H3K4me3 distribution at Ccl2 locus in pericytes. Black bar below RBPJ profiles indicates the position of peak intervals. Two replicates (Rep1 and Rep2) are shown. Error bars represent s.e.m. Source data are provided as a Source Data file

