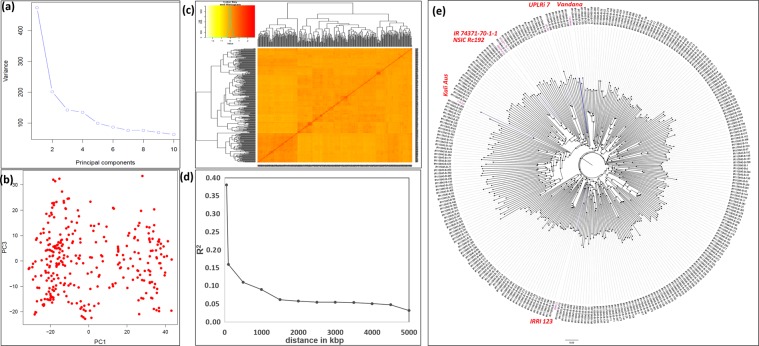
Figure 2.
Genetic relatedness and population structure of complex mapping breeding population association panel: (a) a screen plot showing most of the variability explained by the first two principal components (PCs) for association study, (b) variation of the first two PCs, (c) kinship values, (d) average LD as a function of inter-SNP marker distance estimated in the complex mapping breeding population association panel, and (e) phylogenetic neighbor-joining tree of the complex mapping population used for phenotyping under direct-seeded conditions.

