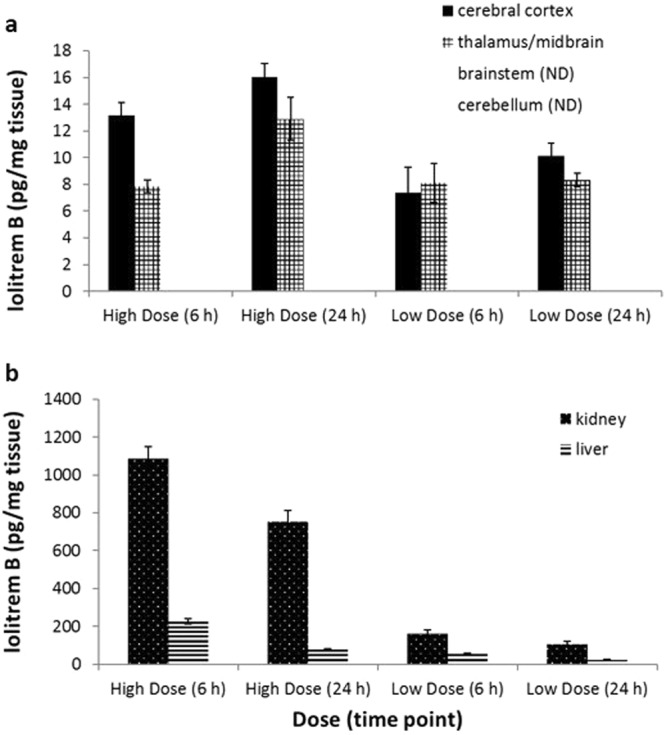
Figure 5.

Lolitrem B concentrations in lipophilic extracts of tissues harvested at 6 h and 24 h post treatment (a) showing lolitrem B accumulation over time, in the cerebral cortex: LolBHIGH [(6 h, n = 6), (24 h, n = 8)] and LolBLOW [(6 h, n = 3), (24 h, n = 4)] as well as the thalamus: LolBHIGH [(6 h, n = 7), (24 h, n = 6)] and LolBLOW [(6 h, n = 3), (24 h, n = 7)]. Lolitrem B was below the detection limit in the cerebellum and brainstem regions. Graph (b) shows elimination of lolitrem B over time from the kidney: LolBHIGH [(6 h, n = 7), (24 h, n = 8)] and LolBLOW [(6 h, n = 7), (24 h, n = 8)], as well as from the liver: LolBHIGH [(6 h, n = 7), (24 h, n = 8)] and LolBLOW [(6 h, n = 8), (24 h, n = 8)]. All data are mean ± S.E.M.
