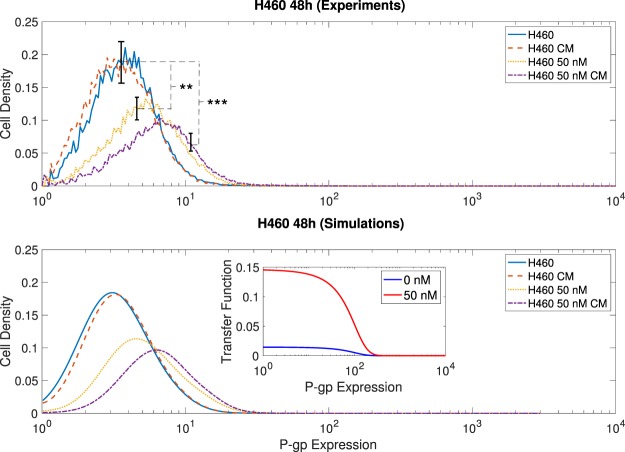
Figure 5.
Detection of P-gp transfer during 48 h in different culture media with sensitive cells (). Upper/lower rows represent the experimental results and the model predictions, with the corresponding calculated MV transfer function (inset). The culture media comprised only the H460 cells (blue solid curves), H460 cells grown in a conditioned medium (CM) exchanged from the H460/R cells to the H460 cells medium (red dashed curves), H460 cells grown in the presence of 50 nM of DOX (yellow dotted curves) and H460 cells grown both in the presence of 50 nM of DOX and CM (violet dashed-dotted curves). Asterisks in the upper row denote the p-values for pairwise comparisons: (**)p < 0.005 and (***)p < 0.0005.

