Fig. 6.
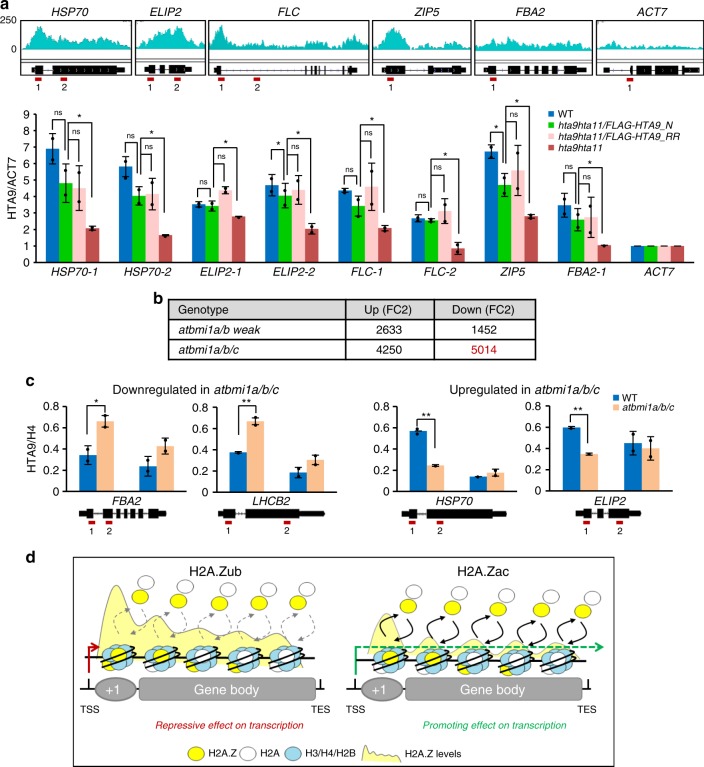
H2A.Zub more than H2A.Z incorporation is required for repression. a HTA9 levels analyzed by chromatin immunoprecipitation–quantitative polymerase chain reaction (ChIP-qPCR) at different genes in wild-type (WT), hta9hta11/FLAG-HTA9_N, hta9hta11/FLAG-HTA9_RR and hta9hta11 plants at 7 days after germination (DAG). Browser views of H2A.Z levels in WT at the selected genes and schematic representation of each gene with red lines indicating the position of amplified regions are shown. HTA9 levels were normalized to ACT7. Error bars indicate standard deviation of n = 2 biological replicates. Data points are indicated in the bar charts. Significant differences as determined by Student’s t test are indicated (*P < 0.05; ns, not significant). b Number of genes upregulated and downregulated determined by RNA-seq in atbmi1a/b weak and atbmi1a/b/c compared to WT seedlings at 7 DAG. Downregulated genes in atbmi1a/b/c are highlighted in red. c HTA9 levels analyzed by ChIP-qPCR at two downregulated and two upregulated genes in atbmi1a/b/c (Supplementary Fig. 6b, c). A schematic representation of the genes is included indicating the position of amplified regions (red lines). HTA9 levels were normalized to H4 levels. Error bars indicate standard deviation of n = 2 biological replicates. Data points are indicated in the bar charts. Significant differences as determined by Student’s t test are indicated (*P < 0.05; **P < 0.01). d Proposed model for H2A.Z-mediated gene regulation in which monoubiquitination of H2A.Z is required for transcriptional repression (left) and acetylation of H2A.Z for transcriptional activation, while H2A.Z levels along the genes are consequence of the transcriptional activity, where transcriptional repression leads to accumulation of H2A.Z (left) and active transcription to decreased levels of H2A.Z (right). Source data of Fig. 6a, c are provided as a Source Data file

