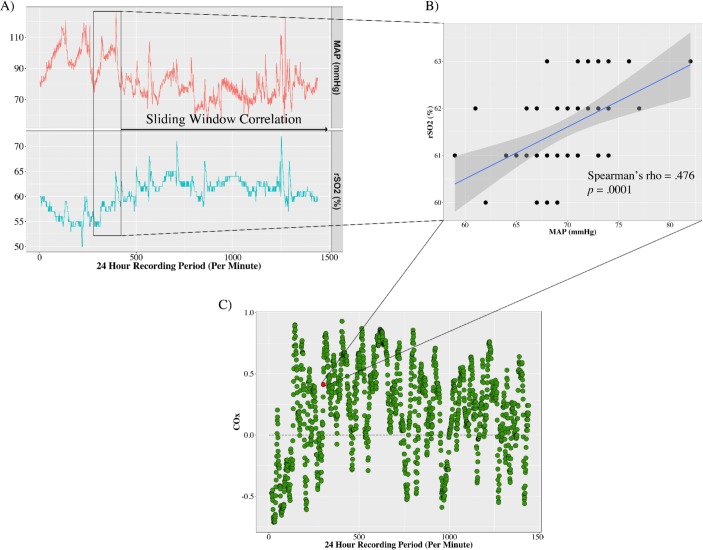
Figure 3.
(A) Simplified line graph (24 hours instead of the full 72 hours recording period) illustrating the sliding window correlation between mean arterial pressure (MAP) and regional cerebral oxygenation (rSO2) for an individual patient over a 24 period of recording. The black rectangle represents a 60 min window that moves forward 1 min at a time until the recording period is completed. (B) Scatter plot illustrating a time dependent positive association between MAP and rSO2. Black dots represent data collected for an individual patient over 24 hours, with the blue line representing a linear model fit to the data, and the grey shaded region representing the 95% CI. (C) Scatter plot indicating the time varying association between MAP and rSO2 represented as the Cerebral Oximetry Index (COx) over an individual patient’s 24 hours recording period. Statistically significant (p<0.0001) positive COx values represent dysfunctional cerebral autoregulation, with negative or near zero values indicating intact cerebral autoregulation.

