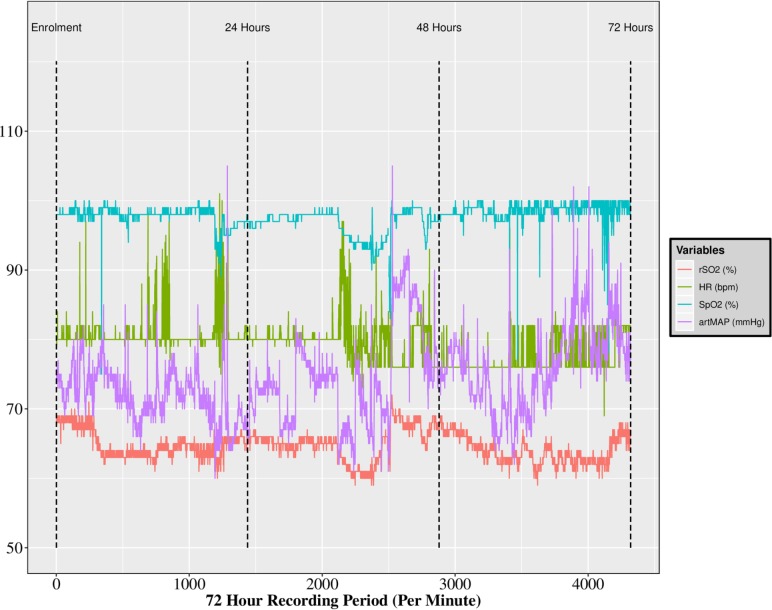
Figure 4.
Line graph of the high frequency vital sign recordings indicates the highly variable relationships with regional cerebral oxygenation over the 72 hours period of recording. The figure represents a single patient’s ICU recording. artMAP, mean arterial pressure from an arterial line; HR, heart rate; ICU, intensive care unit; rSO2, regional cerebral oxygenation; SpO2, peripheral oxygen saturation.

