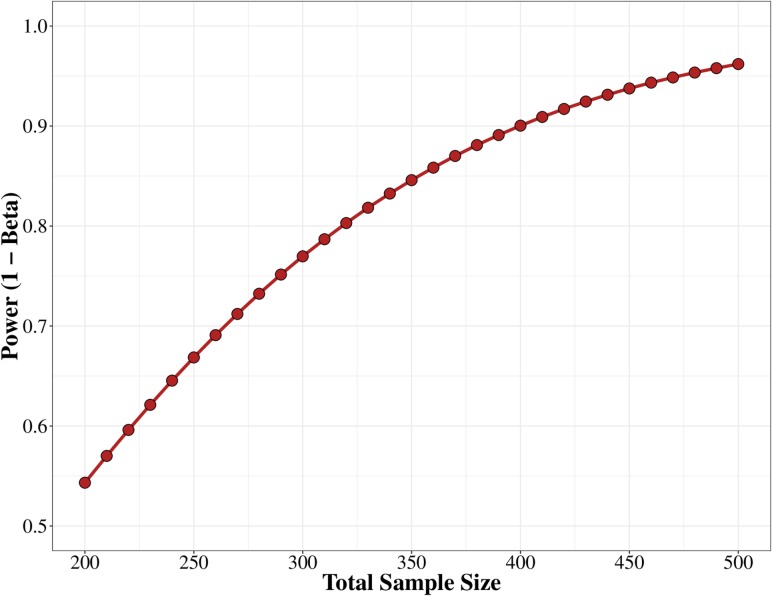
Figure 5.
A power curve indicating the study sample size, and the respective statistical power, to asses the primary study outcome. Red dots represent the sample size needed for a given statistical power. The primary sample size was calculated using the following multivariate regression model parameters: 10 independent variables tested, controlling for 9 additional covariates, power=0.90, R2=0.050, α=0.05, which would require a sample size of 400.

