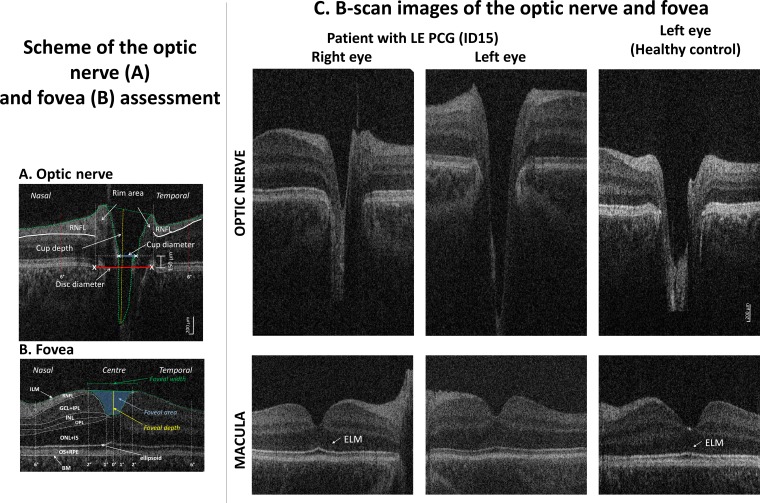
Figure 1.
Hand-held optical coherence tomography (HH-OCT) images of the optic nerve (ON) (A) and fovea (B) of the left eye of patient 6: (A) horizontal B-scan through the centre (deepest excavation) of the optic disc; the disc diameter was defined as an interval between the edges of Bruch’s membrane (red line), the cup diameter as the distance between the nasal and temporal internal limiting membrane (green dotted line) 150 µm anterior to the plane of the disc (blue line), the rim area consisted of the area anterior to the same plane (white dotted lines) within the disc edges (white vertical lines) and the internal limiting membrane (green dotted lines); maximal cup depth (vertical yellow line) was measured using a line perpendicular to the line between the cup diameter (blue line) and the deepest point of the cup; RNFL thickness was measured at 6° from disc margins (red dotted lines). (B) Horizontal B-scan of the fovea with labelled individual retinal layers (BM, Bruch’s membrane; ILM, inner limiting membrane; RNFL, retinal nerve fibre layer; GCL, ganglion cell layer; INL, inner nuclear layer; IPL, inner plexiform layer; IS, inner segment; ONL, outer nuclear layer; ELM, external limiting membrane; OPL, outer plexiform layer; OS, outer segment; RPE, retinal pigment epithelium). Retinal layer thickness was measured in the centre of the fovea, in the paracentral area (from 1° nasally to 1° temporally) and nasally and temporally (from 2° to 6°). The green line connecting the most prominent positions of the ILM nasally and temporally was used to define the foveal width; the yellow line indicates the foveal depth (the axial distance from the green line to the deepest point of the foveal pit); the area in blue indicates the foveal pit area. (C) Horizontal spectral domain–optical coherence tomography B-scan images of the optic nerve (top) and fovea (bottom) of patient 20 with primary congenital glaucoma in the left eye (PCG, middle column), an unaffected left eye (left column) and an eye of a healthy age-matched, gender-matched and ethnicity-matched control child (right column). On the ON scan, a larger and deeper cup is seen in PCG. On the foveal scan, the ELM is not visible in PCG while it is distinctly seen in the unaffected eye and in the healthy control.

