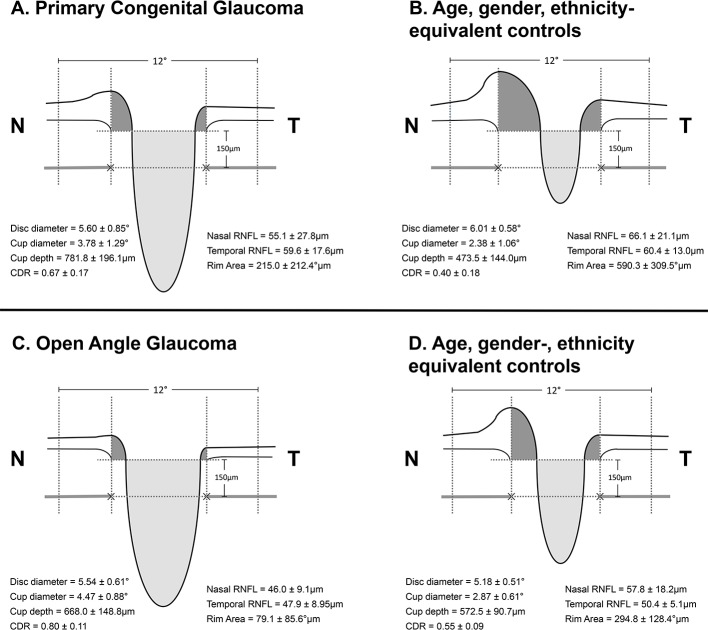
Figure 2.
Cross-sectional schematic diagrams representing mean values of optic nerve head parameters of patients with primary congenital glaucoma, adult open-angle glaucoma and matched healthy controls for each group (numeric values represent mean±SE). The upper horizontal dotted lines represent the horizontal offset (150 µm) used to determine cup diameters and the lower horizontal dotted lines indicate disc horizontal diameters. The vertical dotted lines show the margins of the rim areas. CDR, cup:disc ratio; N, nasal; RNFL, retinal nerve fibre layer; T, temporal.

