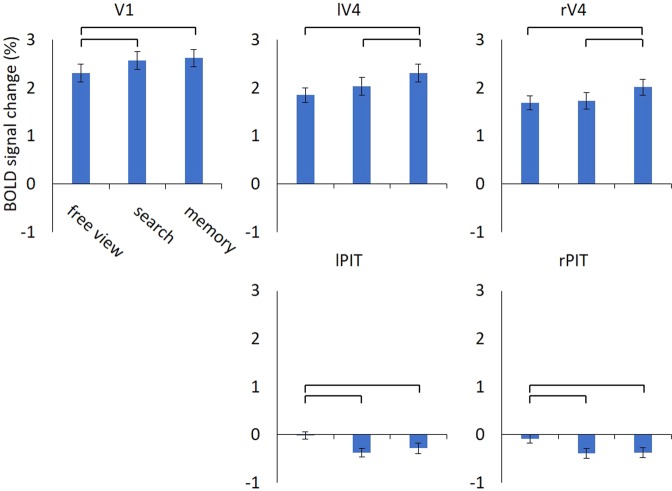
Figure 4.
Average signal changes in response to the scene images. The V1, lV4, and rV4 showed task-related activation, while the lPIT and rPIT showed task-related deactivation particularly during the search and memory conditions. Repeated measures ANOVA revealed significant task effect on all regions (all p’s < 0.05, corrected). Error bars are standard error of the mean, whereas horizontal bars indicate significance in the paired t-test between conditions (all p’s < 0.05, corrected). V1 = primary visual cortex; rV4 = right V4; lV4 = left V4; lPIT = left posterior part of the inferior temporal cortex; rPIT = right posterior part of the inferior temporal cortex.

