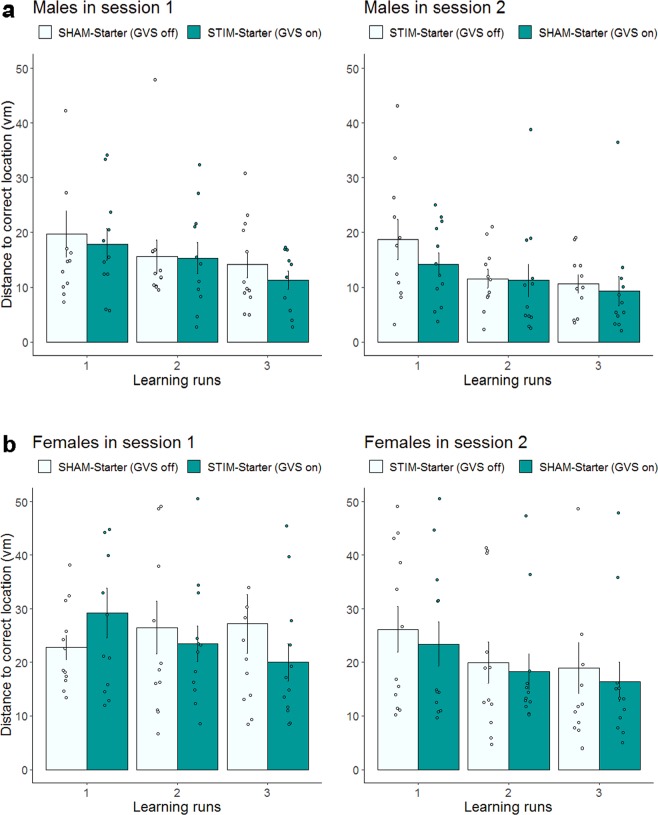
Figure 4.
Spatial learning under noisy GVS and sham stimulation in the learning phase for males (a) and females (b) separately. Distance in vm between memorized location and correct object location for each of the three trials for Session 1 (left panel) and Session 2 (right panel). Dark green indicates GVS was on. Error bars indicate ± 1 SE of the mean. Although spatial learning data were log transformed before analysis, the figures present untransformed values (N = 47).

