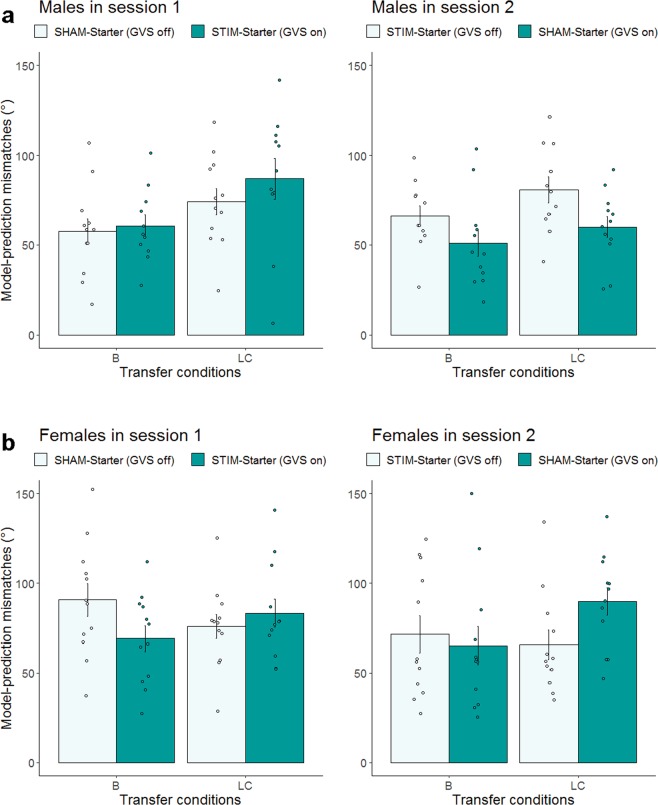
Figure 5.
Effects of noisy GVS stimulation on performance during the transfer phase in Session 1 and 2 for males (a) and females (b) separately. Performance is indicated by the mismatches of behavior vs. model-prediction. Mean differences between observed and model-predicted performance are displayed in angle (°) for the boundary (B) and the location cue (LC) task condition in Session 1 (left panel) and in Session 2 (right panel). Dark green indicates GVS was on. Error bars indicate ± 1 SE of the mean. Although transfer data in females were log transformed before analysis, the (b) presents untransformed values (N = 24).

