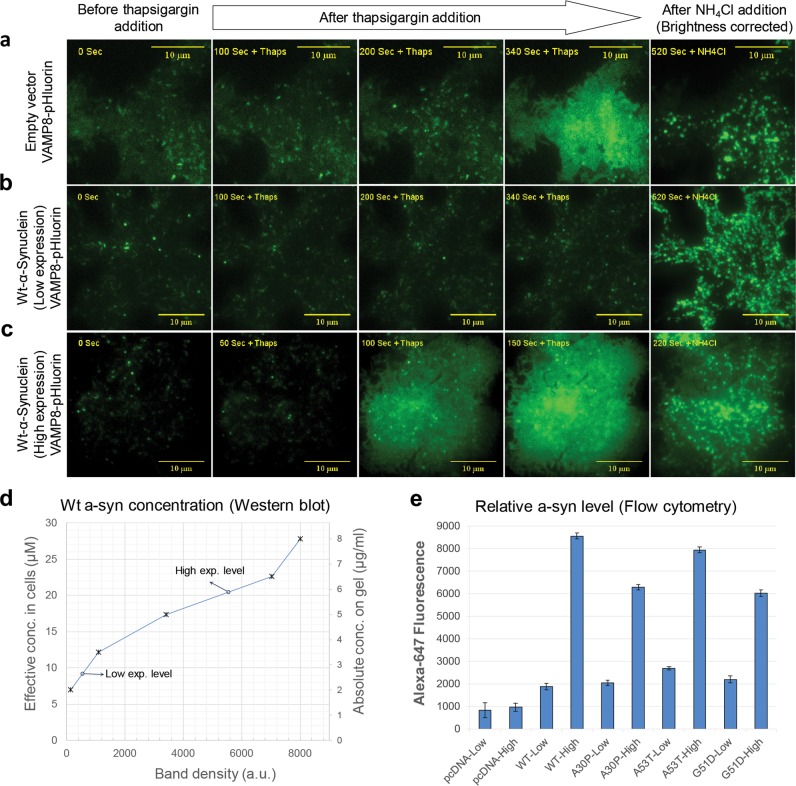
Fig. 2.
Distinct expression levels of Wt a-syn show differential effects on stimulated exocytosis of REs. a–c Snapshots from representative movies taken with TIRFM (Supplementary Movies 1a–c); scale bar = 10 μm. As indicated, RBL cells were co-transfected with VAMP8-pHluorin and empty plasmid pcDNA a or low (5 μg b) or high (25 μg c) levels of this plasmid containing Wt a-syn. Exocytosis was stimulated by thapsigargin, and VAMP8-pHluorin fluorescence increase was monitored before and after stimulation, and after addition of NH4Cl (50 mM, 300–400 s later) to dequench intracellular VAMP8-pHluorin fluorescence. Brightness of images in right-most column was reduced by 50% for better detail visualization. d Concentration of Wt a-syn expressed in RBL cells transfected with low (5 μg) or and high (25 μg) levels of plasmid containing this construct, analyzed from representative western blot shown in Supplementary Fig. 1. All samples in this blot were derived from the same experiment, processed in parallel, and run on the same gel. A calibration curve of band density vs. absolute concentration (right y-axis) was determined for purified Wt a-syn (ӿ). Absolute concentrations of Wt a-syn in transfected cells (o) were determined from the calibration curve after normalizing a-syn band densities with respect to nonspecific bands used as a loading control. The corresponding concentration in RBL cells at low (9 μM) and high (20 μM) expression levels of Wt a-syn was then calculated after accounting for number of cells and cell volume as described in Materials and methods section. e Cells co-transfected with VAMP8-pHluorin and pcDNA, Wt a-syn or a-syn mutants at low (5 μg) or high (25 μg) levels were fixed, immunostained with anti-a-syn and Alexa 647, and analyzed using flow cytometry. Alexa 647 fluorescence histograms were measured for RBL cells gated by VAMP8-pHluorin fluorescence (see Supplementary Fig. 2). Averaged peak values of histograms from three independent experiments, with 15,000–20,000 total VAMP8-pHluorin labeled cells were analyzed for each sample type shown. Error bars are coefficients of variance

