Figure 1.
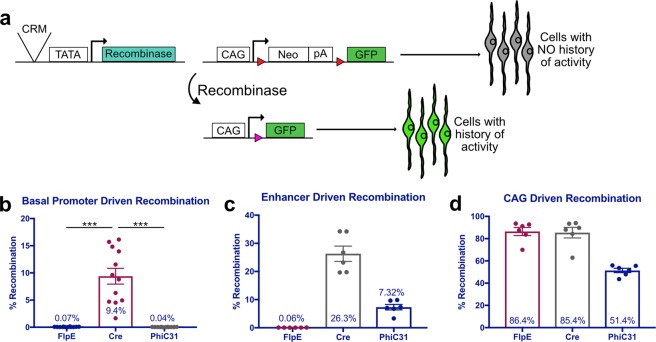
Quantification of lineage trace recombination efficiencies mediated by FlpE, Cre and PhiC31. (a) Schematic representation of recombinase-based lineage tracing strategy. Red triangles represent recombinase target sequences. (b–d) Quantification of FACS-analyzed dissociated retinal cells electroporated with a UbiqC::TdTomato electroporation control, a FlpE, Cre, or PhiC31 recombinase plasmid, and the corresponding responder vector. Retinas were electroporated at E5 and fixed after two days in culture. (b) Quantification of basal recombination, with recombinase plasmids driven by a basal promoter (TATA box). Error bars represent 95% confidence intervals, n = 12, p < 0.001 upon Kruskal Wallis test with post hoc Dunn test. (c) Quantification of enhancer-driven recombination, with recombinase plasmids driven by the ThrbCRM1 enhancer element. Error bars represent 95% confidence intervals, n = 6. (d) Quantification of ubiquitous recombination, with recombinase plasmids driven by the ubiquitous CAG promoter. Error bars represent 95% confidence intervals, n = 6. CRM, cis-regulatory module; bp, basal promoter; pA, polyadenylation sequence.

