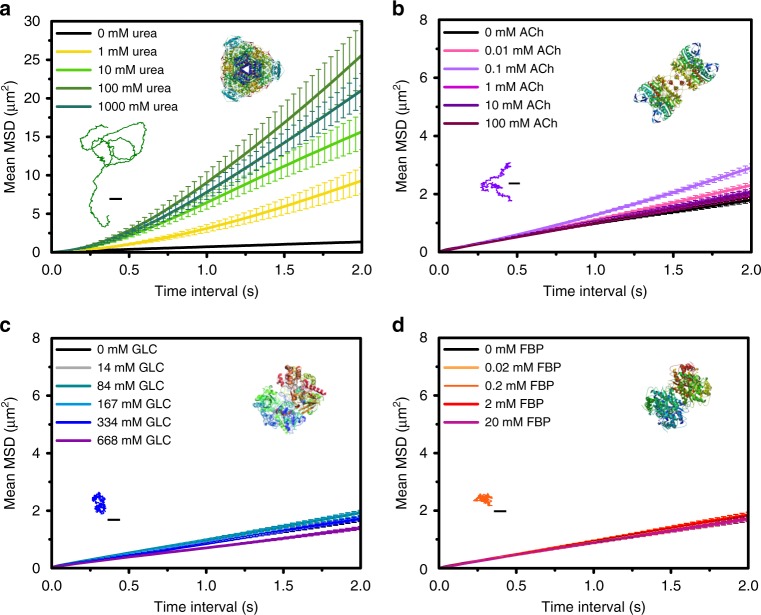
Fig. 2.
Motion dynamics UR, AChE, GOx, and ALS micromotors. Average MSD over time for different substrate concentrations: a UR-HSMM, b AChE-HSMM, c GOx-HSMM, and d ALS-HSMM. Inset: representative trajectories for a UR-HSMM with 100 mM urea, b AChE-HSMM with 0.1 mM acetylcholine (ACh), c GOx-HSMM with 334 mM glucose (GLC), and d ALS-HSMM with 0.02 mM fructose 1,6-bisphosphate (FBP) (scale bars: 2.5 μm). Enzyme structures are extracted from RCSB PDB (see Supplementary Note 3). Results are shown as the mean ± standard error of the mean (s.e.m.). Twenty particles were analyzed per condition. Source data are provided as a Source Data file

