Figure 2.
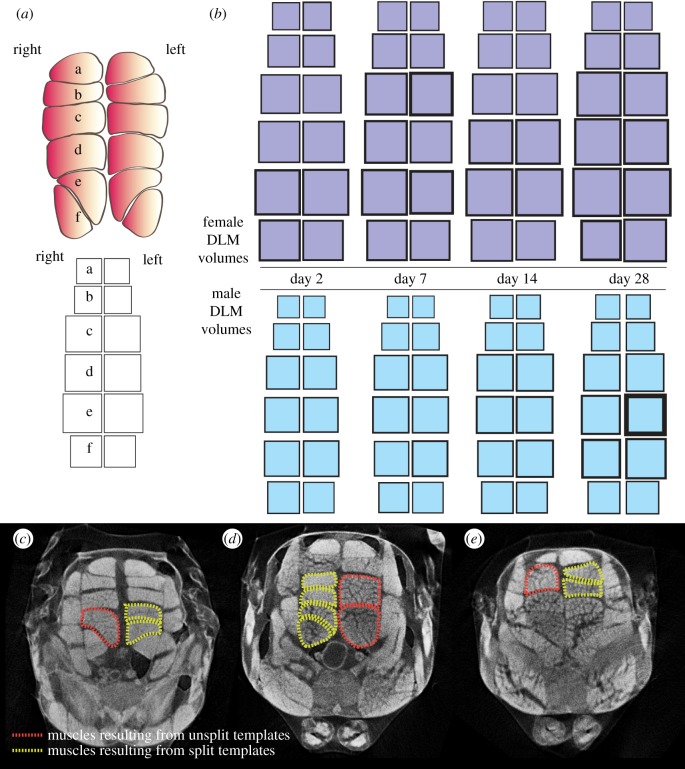
DLM volume maps for males and females post-eclosion. (a) Schematic of DLM nomenclature. DLM fibres located in the left and right hemithorax are indicated. Individual fibres are marked ‘a’ to ‘f’ arranged in a dorsal to ventral manner. The lower panel schematizes a volume map of one full set of DLMs from one animal. The area of each square is proportional to the respective muscle's volume. Each square in the map corresponds to the position of the represented muscle in the thorax. (b) Average individual muscle fibre volumes mapped as described in (a), for females (purple) and males (blue) at days 2, 7, 14 and 28 post-eclosion. Border thickness for each square represents half the s.e.m. in volume for that muscle, group and time point. n = 14–21 animals per sex per time point. (c–e) Examples of DLM fibres resulting from template splitting defects: cross sections of three different whole thorax microCT scans. Yellow dotted lines outline stereotypically split DLMs, as opposed to those outlined in red dotted lines where template splitting failed during pupariation.

