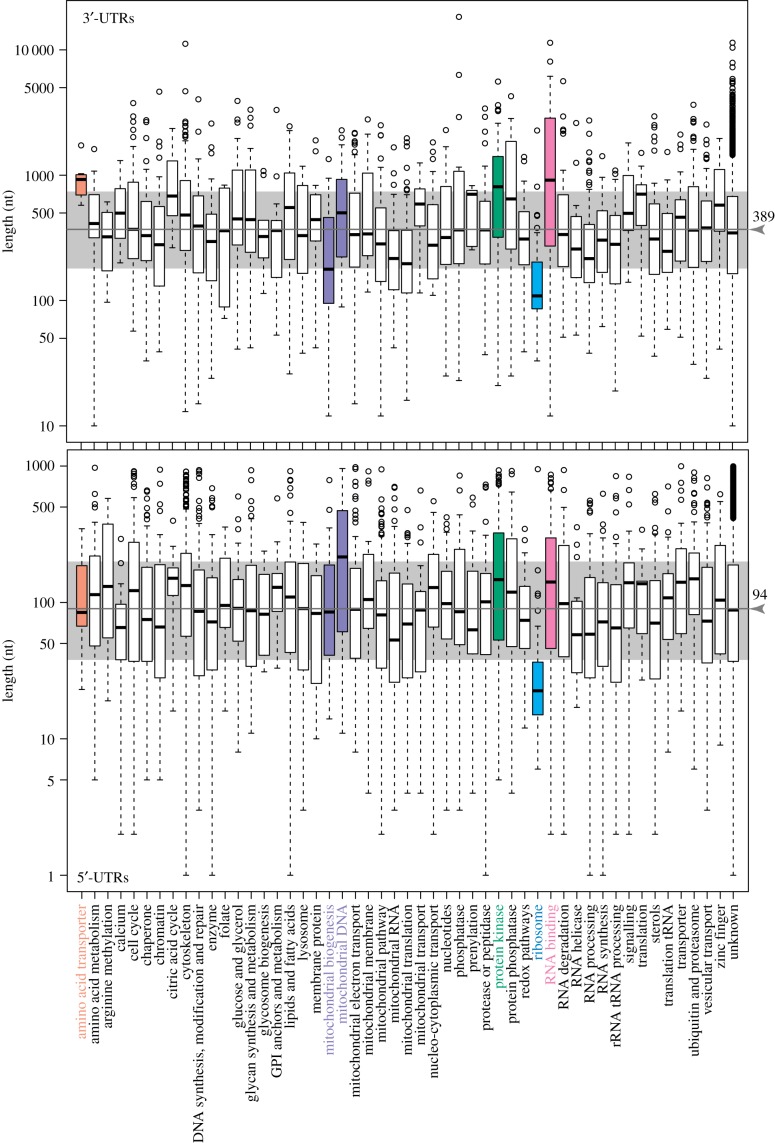
Figure 6.
Lengths of 3′- and 5′-UTRs for mRNAs encoding proteins belonging to different functional classes. Protein classes were assigned manually, according to genome annotations and publications [171]. UTR lengths were downloaded from TritrypDB and are shown on a log scale (electronic supplementary material, Note 40). The boxes indicate the 25th and 75th percentiles, and the bar within the box is the median (label is in nt). Whiskers extend to the most extreme measurement that is within 1.5× the inter-quartile range, and spots are outliers. The dark grey line indicates the overall median, and the pale grey area is between the overall 25th and 75th quartiles. Colours indicate classes in which the medians for the 5′- and/or 3′-UTRs are outside the overall 25th–75th percentile range.

