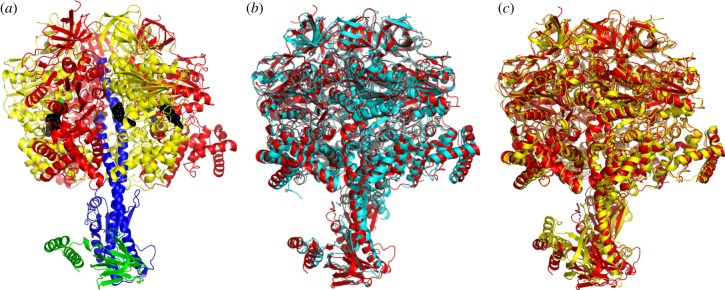
Figure 2.
Structure of F1-ATPase from F. nucleatum. (a) Side view of the structure of molecule 1 in ribbon representation with the α-, β-, γ- and ɛ-subunits in red, yellow, blue and green, and bound nucleotides in a black space-filling representation. The green spheres represent Mg2+ ions. (b, c) Comparison of the structure of the F1-ATPase from F. nucleatum (6q45; red) with the structures of F1-ATPases from M. smegmatis [51] (6foc; cyan) and C. thermarum [52] (5ik2; yellow).

