Figure 6.
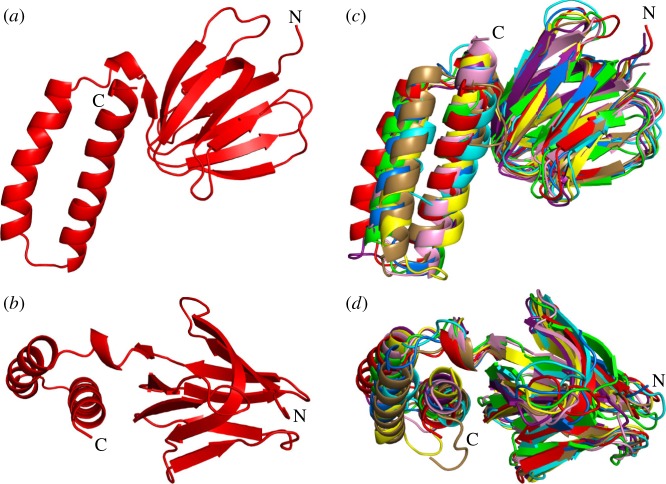
Comparison of the structure of the ɛ-subunit from F. nucleatum with those of orthologues. (a,b) The F. nucleatum ɛ-subunit (6q45, red) viewed from beneath the α3β3-domain along the axis of the central stalk and rotated by 90°, respectively; (c,d) the same views as in (a) and (b) with the structures of ɛ-subunits from the following species superimposed; M. smegmatis [51] (6foc; cyan); C. thermarum [52] (5ik2; yellow); E. coli [68] (1aqt; pink); G. stearothermophilus [69] (2e5y; purple); S. oleracea [53] (6fkf; marine blue); and T. elongatus [70] (5zwl; wheat); and with the δ-subunit from bovine mitochondrial F1-ATPase [15] (1e79;green).

