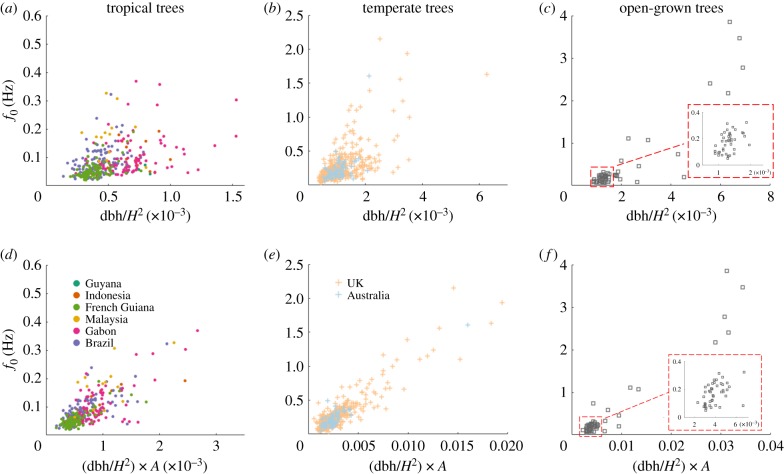
Figure 5.
Simulated fundamental frequencies. (a–c) Cantilever beam approximation predicting simulated f0. (d–f) Predicting simulated f0 using architectural information. Here A = (CVR + crown asymmetry + aspect ratio). Panels a,d are tropical forest trees, b,e are temperate forest trees and c,f are open-grown trees. The red-outlined insets in panels c,f give a closer view of the data near the origin, these sections correspond to the subsample for which summary statistics are given in parentheses in table 1. Note the difference in y-axis ranges.

