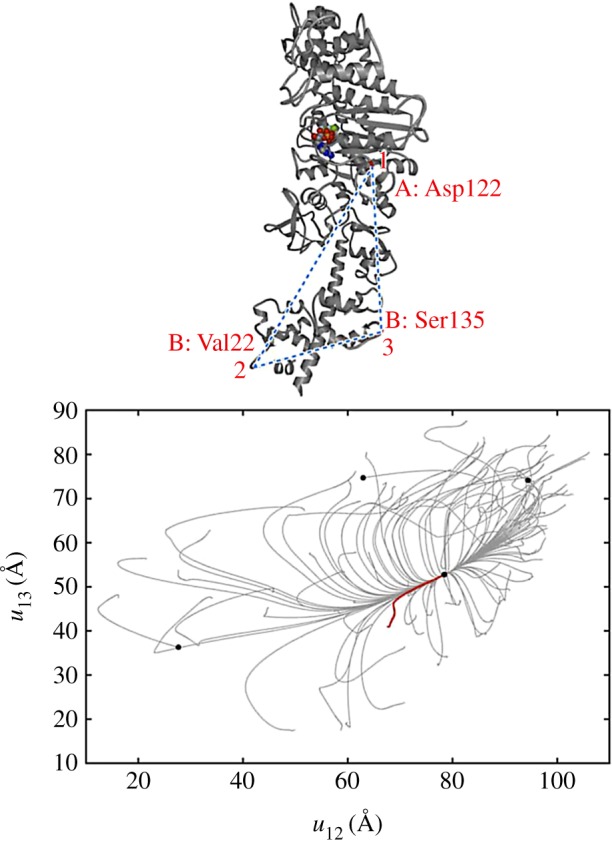
Figure 9.

Conformational relaxation in myosin V. Here, 100 relaxation trajectories starting from different initial network conformations are plotted in the plane of distances between the labels (1,2,3) indicated above. Black dots mark the equilibrium and the metastable states reached. The ATP-bound equilibrium structure is taken as a reference state. The red trajectory corresponds to the conformational transition upon ATP binding. Adapted from [28]. (Online version in colour.)
