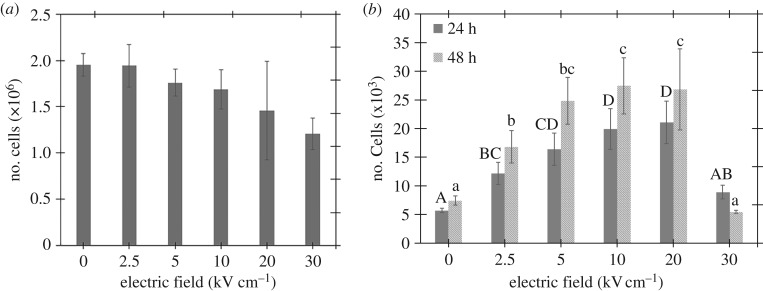
Figure 2.
(a) Myoblast count immediately after treatment to plates with an identical number of cells in each well. (b) Myoblast population determined by MTT assays 24 and 48 h after five 300 ns PEFs. The Tukey groupings are labelled above each column to compare the treatments showing a significant difference (p < 0.05). In all cases, the electric field is calculated as E = V/D, where V is the applied voltage and D is the gap distance of the cuvette (0.2 cm).

