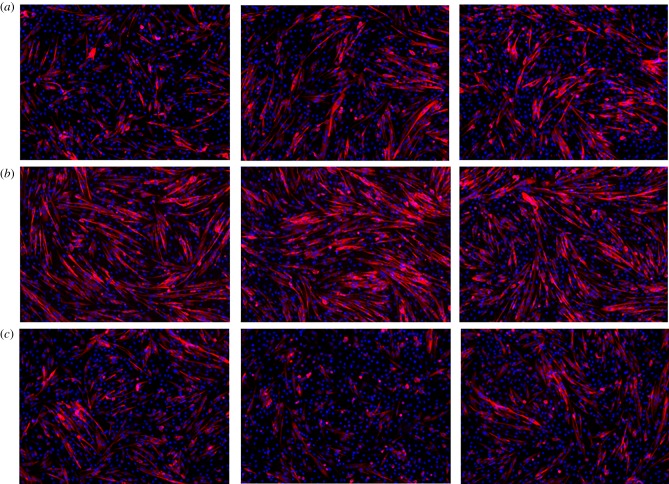
Figure 3.
Representative immunostaining images from portions of three different wells of untreated myoblasts (a) and myoblasts following exposure to five 5 kV cm−1 (b) or 25 kV cm−1, 300 ns (c) PEFs. The red and blue mark the myosin heavy chains and cell nuclei, respectively. The myoblasts treated with 5 kV cm−1 have a larger concentration of red cells, indicating increased proliferation. These images show that the 25 kV cm−1 treatment induced less myoblast fusion compared to the control and the 5 kV cm−1 field treatment. (Online version in colour.)

