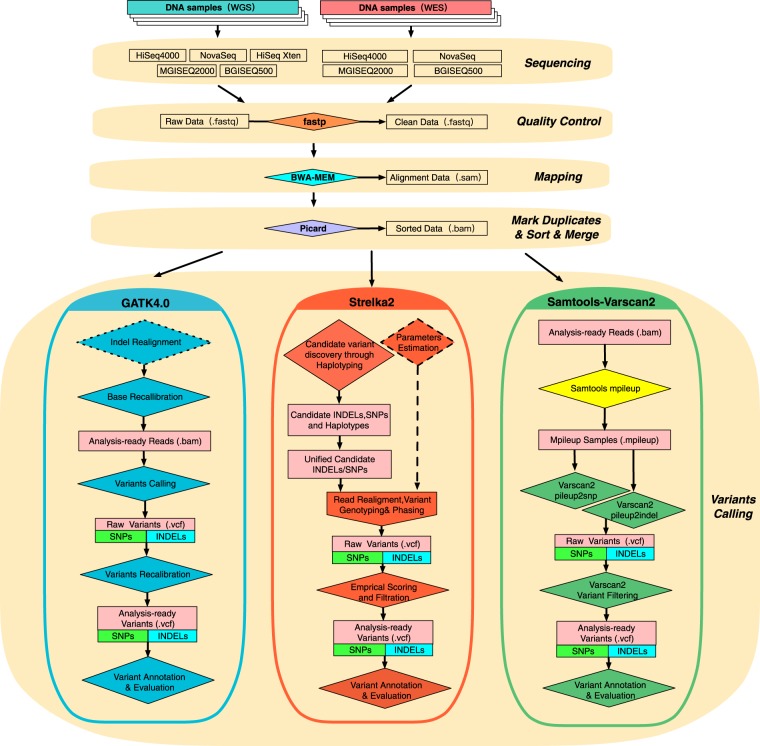
Figure 1.
The flowchart of combinations using different sequencers and variant calling pipelines for germline variants. This workflow diagram reflects the designed comparison processes of the variants calling combinations. Key process for NGS data analysis were shown on the right. Squares in the flowchart represent data files, and rhombus indicate processes (the rhombus with dotted line mean that process were optional). After library preparation, samples are sequenced on multiple platforms to produce the raw datasets. The next steps are quality assessment and read alignment against a reference genome, followed by marking duplicates and sorting. Analysis-ready files of different platforms are analyzed by three variants calling pipelines using author-recommended parameters to generate VCF files, which were used for the final performance comparison of different combinations.

