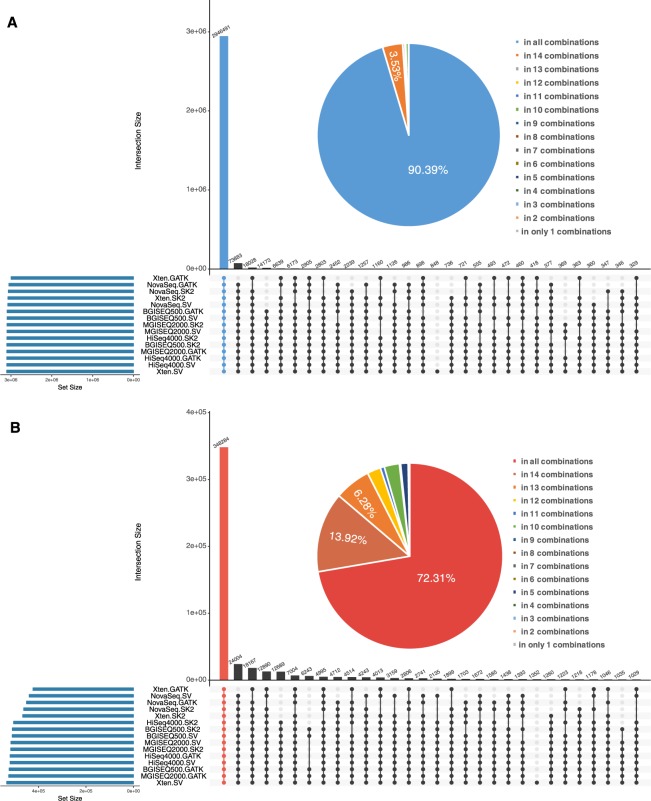
Figure 6.
Intersection of variant Calling Results of all Combinations in SNPs and INDELs of WGS datasets. The top bar-plot indicates the intersection size. This plot provides the number of variants that are uniquely called by one tool (a single point) or the numbers of variants called by many tools (two or more points). The bottom left plot indicates the set size. The linked points below display the intersecting sets of interest or which tools called variants. (A) UpSetR plot indicates intersection of variant calling results of all combinations in SNPs. (B) UpSetR plot indicates intersection of variant calling results of all combinations in INDELs.

