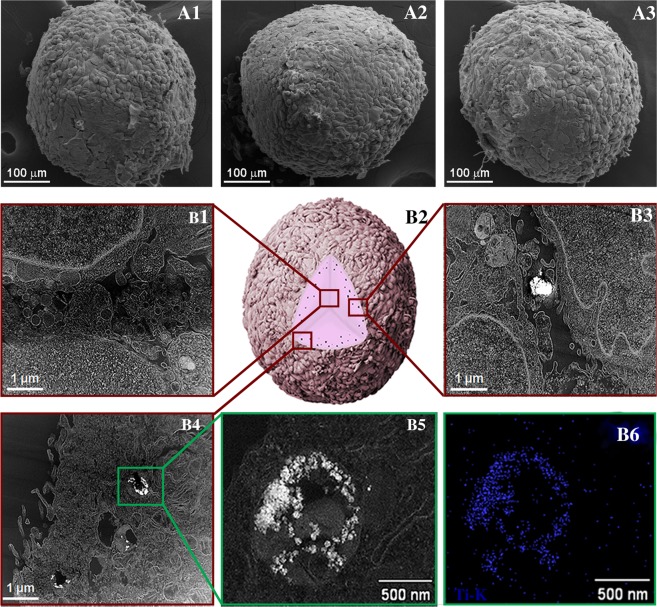
Figure 5.
Spheroid organization and TiO2 NPs internalization: (A1) SEM micrograph of spheroids in the control condition (without NPs); (A2) with 5 and (A3) 100 µg/ml TiO2 NPs exposure for 72 hours. (B1–B6) Internalization and distribution of TiO2 NPs in spheroids exposed to 100 µg/ml NPs; (B1) Scanning TEM (STEM) micrograph of the interior of the spheroids. (B2) Schematic illustration of the penetration behavior of TiO2 NPs, (B3) STEM micrograph of the outer layers of the spheroid showing TiO2 NPs in the space between cells, (B4) and in membrane-vesicle, (B5) high magnification of the membrane vesicle, (B6) STEM/EDS map of Ti-K X-ray line confirming the presence of TiO2 NPs. Images are representative of four independent analysis.

