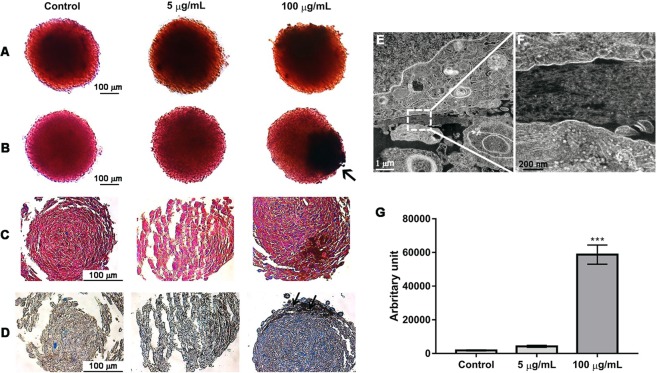
Figure 6.
Spheroid differentiation, mineralization and matrix organization after TiO2 NPs exposure (5 and 100 µg/ml of TiO2 NPs during 72 hours): cross sections of paraffin-embedded spheroids stained with: (A) alkaline phosphatase for differentiation, (B) Alizarin Red S to visualize calcium deposition, (C) and Masson’s trichrome and (D) aniline blue staining for collagen. Images shown are representative of three independent experiments with triplicates. The arrows indicate the presence of TiO2 NPs. (E,F) TEM image of an ultrathin section of an osteoblast spheroid where inset delineated by a dotted line in E is magnified in F and demonstrate the presence of collagen fibrils. (G) Quantification of collagen deposition was performed by Blue pixel analysis and quantification in aniline blue sections using Image J software. Data show mean ± SD of three independent experiments in triplicates for each condition. *P < 0.05 vs control.

