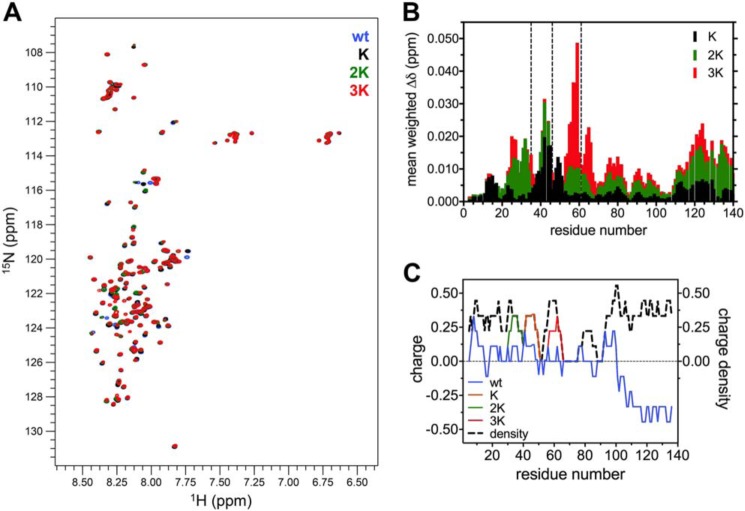
Figure 2.
NMR spectroscopy of the E46K-like αSyn mutants in the lipid-unbound state. A, overlaid 1H-15N HSQC spectra of 120 μm WT, K, 2K, and 3K αSyn in 50 mm phosphate buffer and 10% D2O (pH 6.8), measured at 15 °C and realigned using Ala-140. B, histogram of the mean weighted chemical shift perturbations (calculated as [(Δδ1H)2+(0.15·Δδ15N)2]1/2) of each mutant versus WT αSyn, plotted against the corresponding residue number. In addition to the N-terminal region, the C terminus is also affected and shows a clear correlation between the entity of the perturbations and the number of Glu-to-Lys mutations. C, charge (and charge density, i.e. absolute charge value) distribution of WT αSyn and its mutants, averaged over a window of nine amino acids. The transition from the N-terminal amphipathic region to the negatively charged C terminus can be observed around residue 100. Glu-to-Lys mutations, although not changing the charge density distribution, increase the charge polarization, making electrostatic N-to-C interactions more favorable.

