Figure 7.
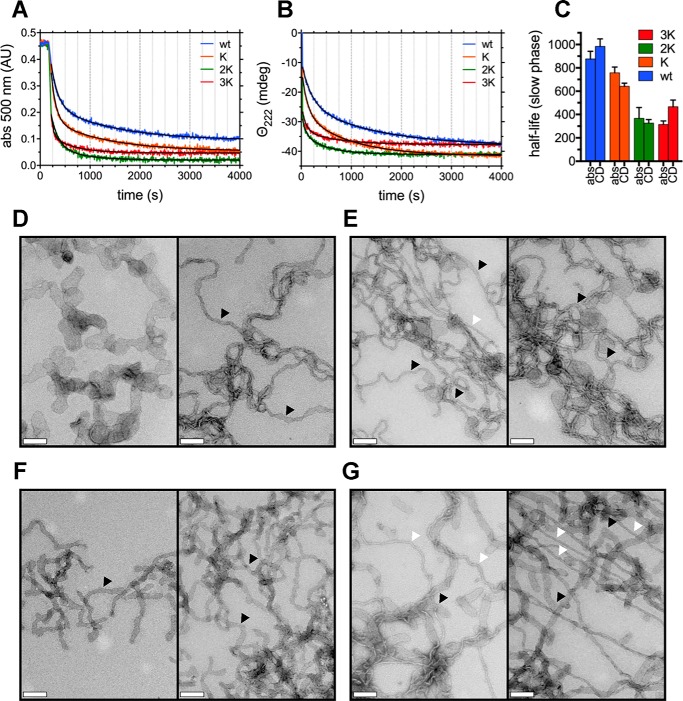
αSyn's Glu-to-Lys mutations result in increased membrane remodeling. A, vesicle clearance experiments, monitored by absorbance at 500 nm of 400 mm 90:10 POPG:POPC MLV dispersions by 40 μm WT αSyn and its E46K-like mutants (lipid:protein molar ratio 10:1). Best fits were obtained using a two-phase exponential decay model (Table S3) and are shown in black. B, vesicle clearance experiments, monitored by CD (222-nm ellipticity), of 400 mm 90:10 POPG:POPC MLV dispersions by 40 μm WT αSyn and its E46K-like mutants (lipid:protein molar ratio 10:1). Best fits were obtained as in A and are shown in black (Table S3). C, histogram of the (slow-phase) half-life values (along with their 95% confidence interval) obtained from the best fit of the clearance kinetics in A and B with a two-phase exponential decay model. As more Glu-to-Lys mutations are introduced, the clearance rate increases (and, thus, half-lives decrease), but the trend plateaus at 3K αSyn. D–G, electron micrographs, negatively stained, of lipid tubule dispersions generated by mixing WT (D), E46K (E), 2K (F), and 3K (G) αSyn to 90:10 POPG:POPC MLV preparations. Scale bars = 200 nm. Although all mutants present the ability to robustly tubulate membranes, with progressive Glu-to-Lys mutations, the number of large, vesicular-like “cisternae” (e.g. D, left) and bilayer tubes (black arrowheads) formed upon incubation with αSyn decreases, and thinner, micellar (e.g. G, right) tubes can be observed (white arrowheads). abs, absorbance.

