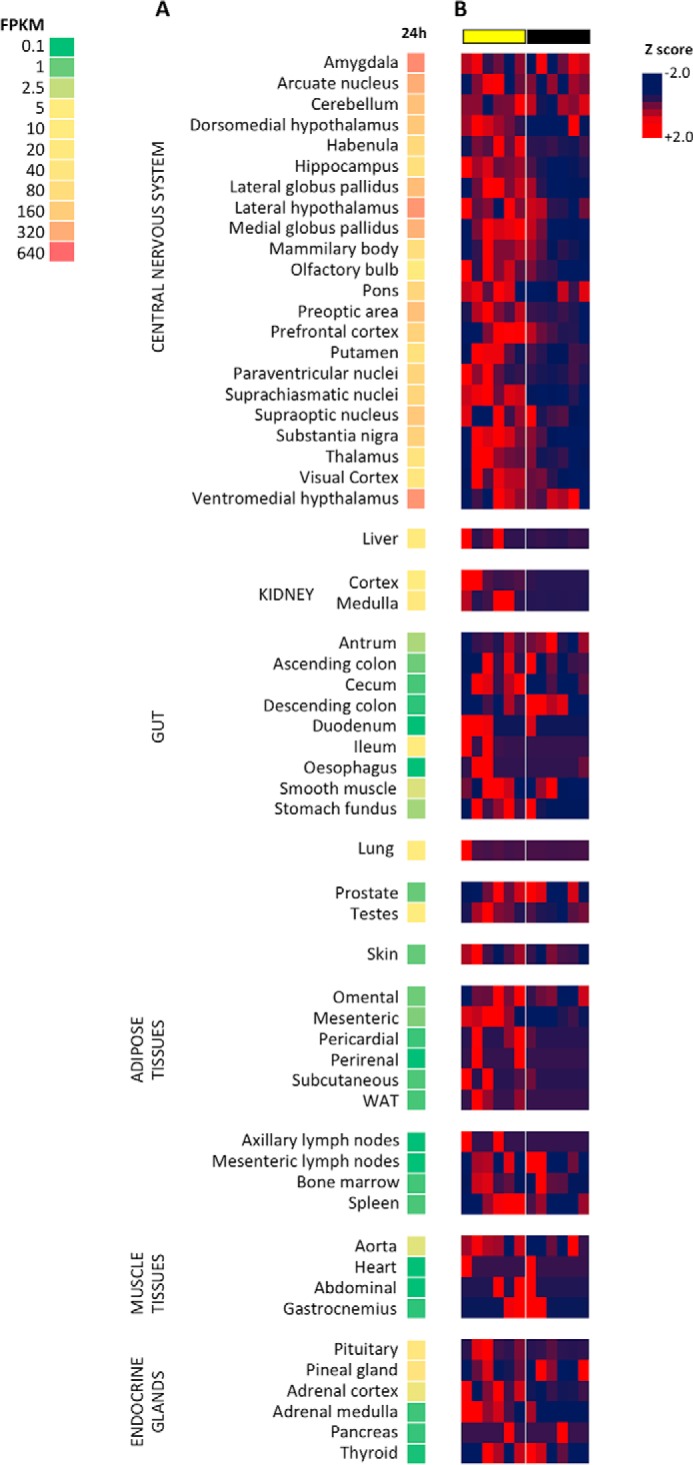
Figure 1.

Relative ENHO expression in baboon tissues (A) and diurnal expression profile within tissues (B). The heat map in A is a single column that shows relative expression between tissues and is read from top to bottom. These data are derived from FPKM averaged over 24 h within each tissue. The heat maps in B show relative expression as a deviation from the 24-h mean (z-score) during a 24-h period within each tissue and should be read left (ZT0) to right (ZT24). The heat maps illustrate the diurnal profile of ENHO expression. Peak ENHO expression (red) is observed in the daytime in most tissues. Lights-on (day time) and lights-off (night time) are indicated by the yellow and black bars, respectively.
