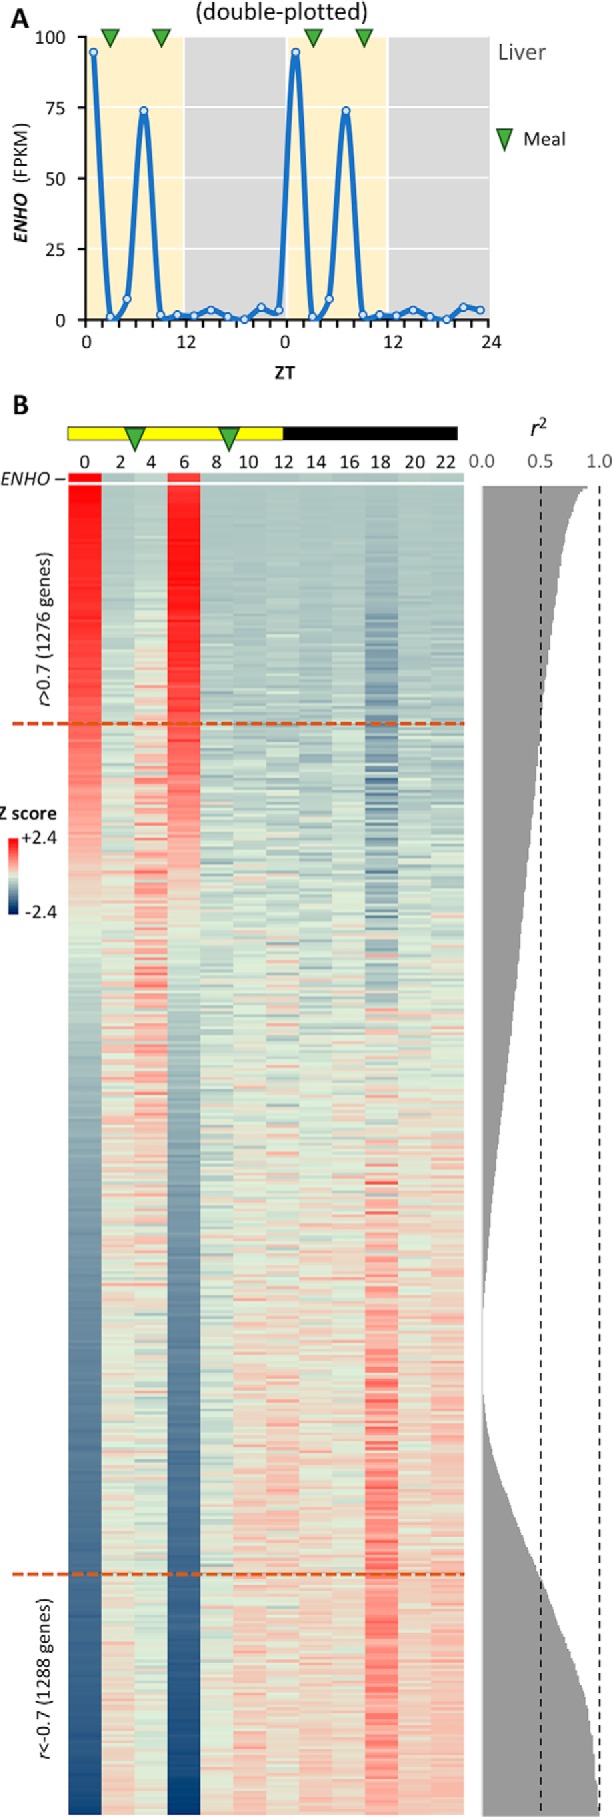
Figure 2.

Hepatic ENHO expression shares a dynamic expression profile with >1200 genes. A, diurnal profile of hepatic ENHO expression shown as a line graph. Meal times are indicated by green arrows. B, heat map comparing profile of ENHO expression (top) with genes ranked by their correlation coefficient (r, high to low when read from the top down) with ENHO. The coefficient of determination (R2) is shown to the right. Lights-on (day time) and lights-off (night time) are indicated by the yellow and black bar at the top of the figure. There are 1276 genes showing a marked positive association and whose expression is mutually inclusive (r < −0.7) with ENHO. For a similar number of genes, ENHO expression appears be mutually exclusive (ENHO is highly expressed as indicated by red coloring and their expression is repressed as indicated by blue coloring).
