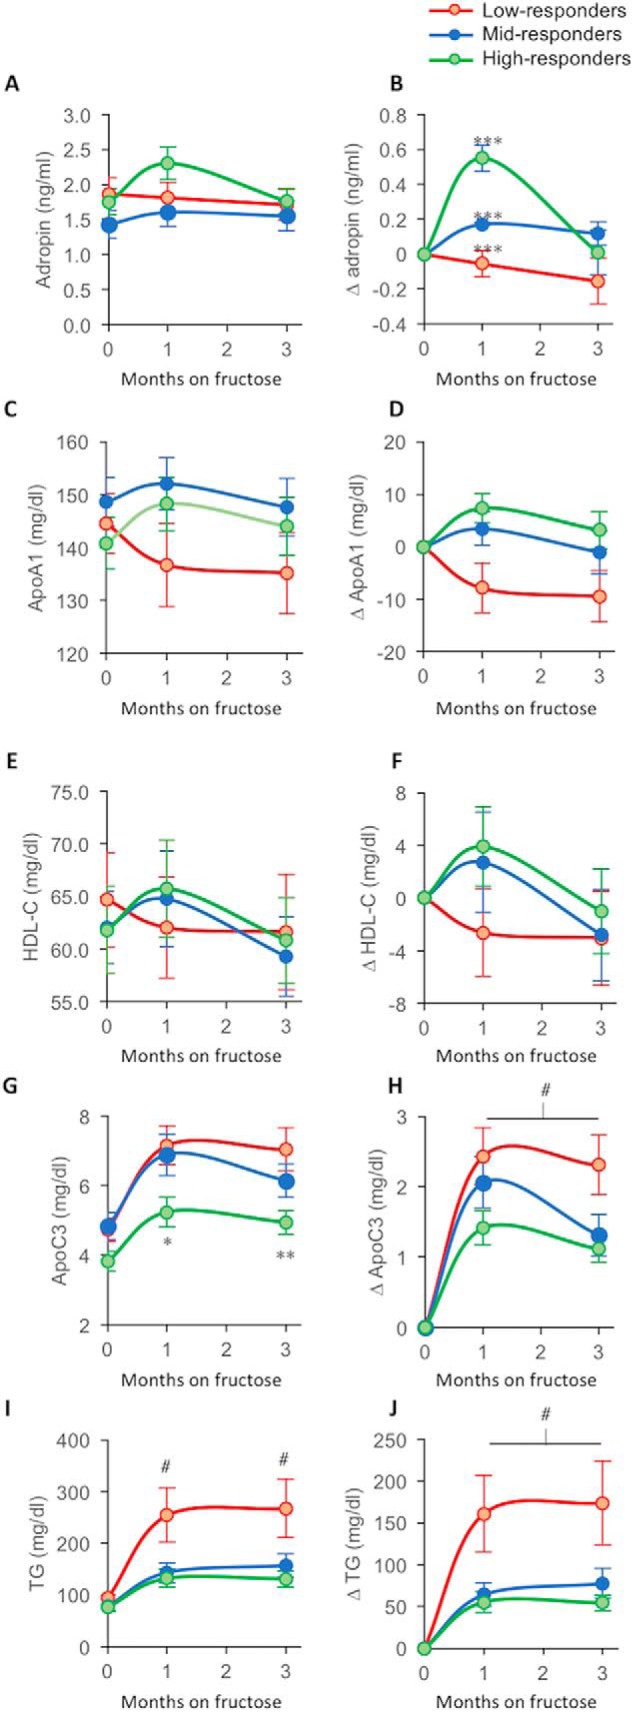
Figure 5.

Lipid parameters in subpopulations of rhesus macaques exhibiting low, medium, or high responses of plasma adropin concentrations after 1 month of fructose consumption. Animals were ranked by changes of plasma adropin concentrations after 1 month of fructose consumption. They were then subdivided into three groups: high-responders, n = 20, green lines/symbols; mid-responders, n = 19, blue lines/symbols; and low-responders, n = 20, red lines/symbols. Shown are the averages for each time point based on the ranking at the 1-month time point. Plasma concentrations of the variable defined in the y axis label are shown in A, C, E, G, and H. Fructose-induced Δs of plasma concentrations of the variable defined in the y axis label (1- and 3-month values subtracted from baseline) are shown in B, D, F, H, and J. “High-responders” exhibit a marked increase in plasma adropin concentration at the 1-month time point (B). ***, p < 0.001 between all groups; #, p < 0.05 versus mid- and high-responders; *, p < 0.05; **, p < 0.01 versus low-responders (within time points). #, low- versus medium-responder, p < 0.05, versus high-responder, p < 0.01 (ANOVA with repeated measures).
