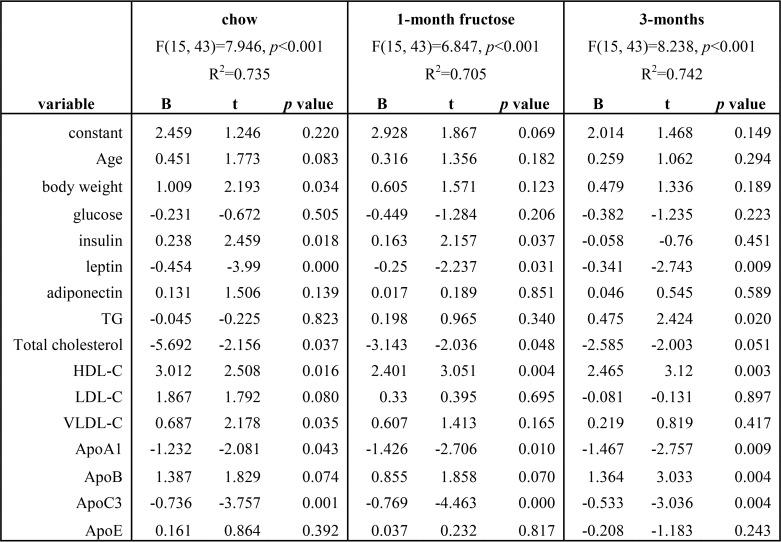
Table 1.
Calculation of plasma adropin concentration using multiple linear regression in male rhesus macaques on chow, and after 1 or 3 months of consuming a fructose beverage (300 kcal/d) (n = 59)
Log-transformed data were used for the analysis. The 1st column presents the independent variables, and the next 3 columns present results from the analysis of data from animals collected at specific time points in the study: baseline (chow) and after 1 or 3 months of fructose consumption. R2 and p values are shown for each calculation in the 1st row. At each time point in the study, modeling was successful in calculating plasma adropin concentration using the variables described in the 1st column, explaining 70–74% of the variation in plasma adropin concentration between individual animals. B is the coefficient, representing the independent contributions of the independent variables (age, body weight, glucose, insulin, etc.) to the prediction of the dependent variable (adropin). The t statistic is the coefficient divided by its standard error.

