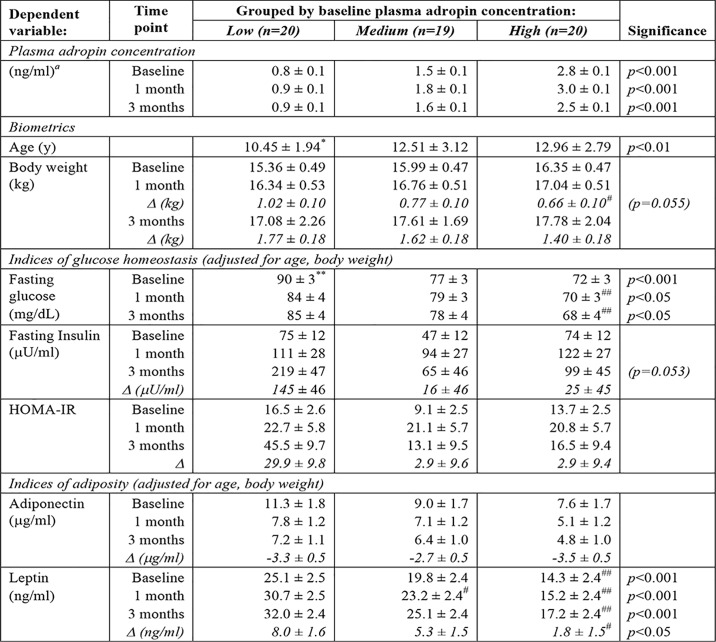
Table 2.
Indices of glucose control in rhesus macaques grouped by low, medium, or high baseline plasma adropin concentration
Age is reported as mean ± S.D. Measurements at baseline, 1, and 3 months are shown as estimated marginal means ± S.E.; covariates are indicated in the table subheading. Changes relative to baseline (Δ) after 3 months on fructose are estimated marginal means ± S.E. adjusted for age and baseline values. The increase in plasma leptin concentrations indicated in the final row (Δ) is after 3 months of fructose consumption. * indicates significantly different from medium (p < 0.05) and high (p < 0.01) adropin groups. ** indicates significantly different from medium and high adropin groups (p < 0.005). #, ## indicates significantly different from low adropin group (#, p < 0.05; ##, p < 0.01).
a Differences between all groups are highly significant, p < 0.001.

