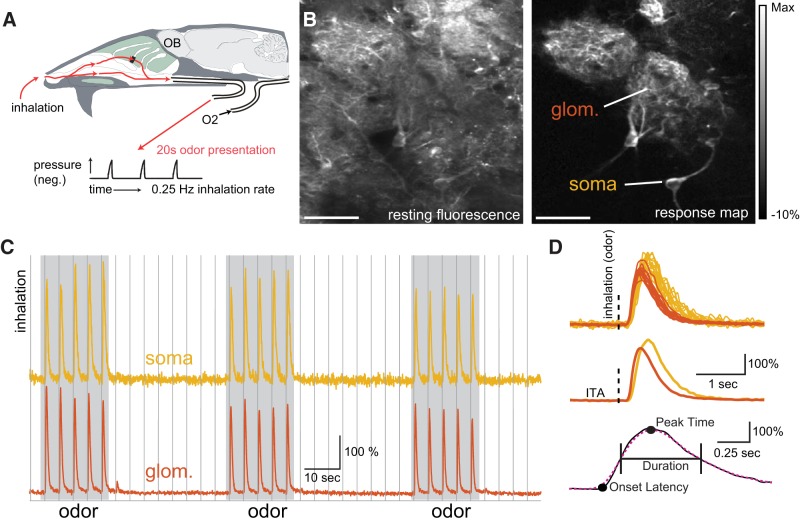
Figure 1.
Imaging inhalation triggered temporal dynamics of OB neuron subtypes. A, Schematic of preparation for artificial inhalation in the anesthetized mouse. Inhalations were generated by a vacuum pulse applied to nasopharynx at 0.25 Hz. B, Example resting fluorescence (left) and inhalation triggered average (ITA) fluoresce change map taken from a glomerulus (glom.) and interneuron somata (soma) in the glomerular layer in a GAD2-Cre:GCaMP6f reporter cross during odorant stimulation. White scale bar = 50 μm. Presumptive PG cell somata and glomerular boundaries are difficult to distinguish in the resting fluorescence image, but are clearly apparent in the response map. C, Traces showing the fluorescence signal imaged from the glomerular neuropil and soma of an associated GAD2+ neuron, from the example in B. Traces show a typical imaging epoch, with three 20-s odor stimuli (gray) presented during 0.25-Hz inhalation (vertical lines). D, Overlaid inhalation triggered calcium signals (top) and corresponding ITAs (middle) taken from the glomerulus and soma during each inhalation in the presence of odorant. Vertical dashed line indicates inhalation onset. Bottom, Schematic illustrating definition of onset latency, time to peak, and response duration. Onset latency was calculated from the ITA trace (solid black line) when the response initially surpassed at least four consecutive frames, 4 SD above baseline. Time to peak (time to maximum response) and response duration (time between the half max and half min points) were calculated from the ITA after applying the Gaussian weighted box filter (dotted magenta line).

