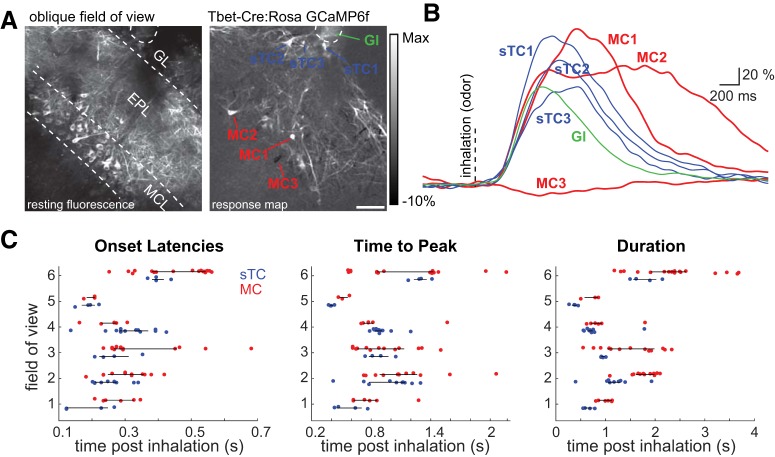
Figure 3.
Diversity of inhalation-linked dynamics of MCs and sTCs within the same field of view. A, Resting fluorescence and odor-evoked ITA response map showing sTCs and MCs imaged in the same field of view using an oblique imaging plane in a Tbet-Cre: Rosa-GCaMP6f mouse during stimulation with methyl valerate. Gl, glomerular neuropil. B, Traces showing ITAs from the sTCs and MCs shown in A, illustrating temporal diversity of inhalation-linked responses across different cell types imaged simultaneously. Vertical dashed line indicates inhalation onset. C, Plots comparing latency, peak time, and duration of ITAs from sTCs (blue) and MCs (red) imaged in the same field of view or successive z-planes, allowing for paired comparisons (see text). Black horizontal line spans the interquartile range. White scale bar = 50 μm.

