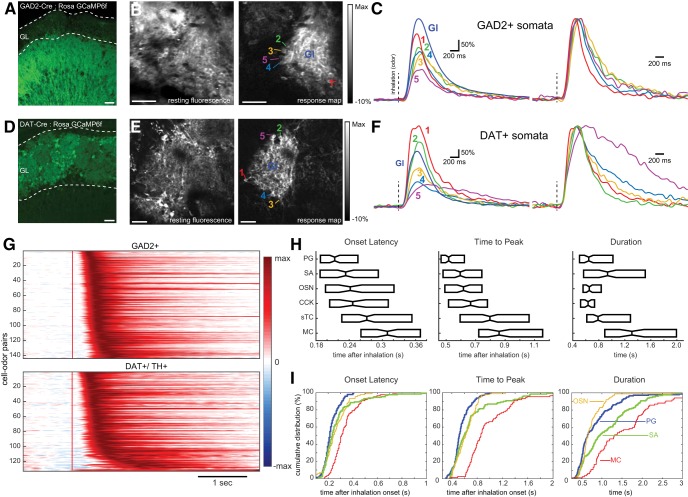
Figure 6.
Juxtaglomerular interneurons show simple and short-latency responses to odorant inhalation. A, GCaMP6f expression in the glomerular layer (GL) of a GAD2-IRES-Cre mouse, showing expression in juxtaglomerular neurons with extensive processes in the GL. Scale bar = 50 μm. B, In vivo resting fluorescence (left) and odorant-evoked ITA response map (right) showing activation of two adjacent glomeruli in a GAD2-Cre: Rosa GCaMP6f mouse. Note that numerous somata are apparent around the periphery of the right glomerulus in the response map. Numbers indicate somata whose ITAs are shown in C. Gl, glomerular neuropil. Scale bar = 50 μm. Odorant was methyl valerate. C, ITA traces from the somata and glomerular neuropil from B. Traces were low-pass filtered at 5 Hz before averaging. The same traces are shown scaled to the same peak values at right. Note that all cells show similar onset latencies with only modest differences in time to peak or duration. D–F, Similar to A–C, but for dopaminergic neurons using a DAT-Cre: Rosa GCaMP6f mouse to target presumptive SA cells. The ITA traces for these DAT+ cells are also all short-latency, with one cell showing a longer-lasting response. Odorant was 2-hexanone. Scale bars = 30 μm (D) and 50 μm (E). Vertical dashed lines indicate inhalation onset. G, Pseudocolor plots of ITA responses for all cell-odor pairs for GAD2+ presumptive PG cells (top) and DAT+/TH+ presumptive SA cells (bottom), displayed and normalized as in Figure 2. Red vertical line indicates inhalation onset. H, Box plot comparisons of ITA onset latencies, time to peak, and half width durations. Medians = center horizontal line. Boxes represent 2nd and 3rd quartiles of each cell populations. I, Cumulative distribution plots of onset latencies, times to peak, and durations for GAD2+ and DAT/TH+ cells highlighted by thicker plots. OSN and MTC populations shown for reference.

