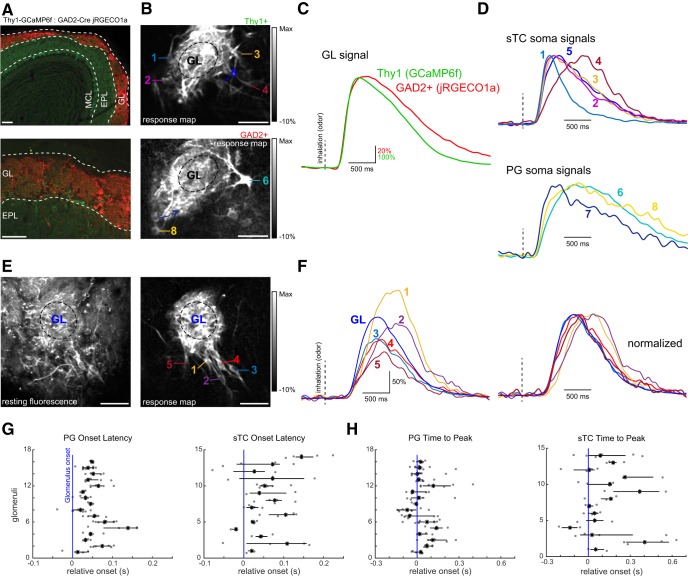
Figure 7.
Diversity of inhalation-linked temporal dynamics is greater in sTC than PG cells innervating the same glomerulus. A, Tissue sections showing GCaMP6f expression (green) in Thy1+ MTCs (green) and jRGECO1a expression in GAD2+ juxtaglomerular neurons, after Flex.jRGECO1a (red) virus injection in a Thy1-GCaMP6f:GAD2-Cre mouse (see Text). Scale bar = 100 μm. B, Odorant-evoked ITA response map showing activation of MTCs recorded in the green channel (top) and GAD2+ neurons recorded simultaneously in the red channel (bottom). Numbers indicate presumed sTCs or PG cells whose responses are shown in D. Odorant was ethyl butyrate. Scale bar = 50 μm. C, Overlay of ITA traces for the Thy1+ and GAD2+ signals recorded from the neuropil of the glomerulus shown in B. Traces normalized to their maximum response to highlight temporal differences. D, ITA traces from the somata indicated in B, with presumptive sTCs (top) and PG cells (bottom) overlaid with each other. All cells appear to innervate the same glomerulus. A 5-Hz low-pass filter was applied to all traces before averaging. Traces are normalized to their maximum response. E, Resting fluorescence (left) and odorant-evoked ITA response map (right) taken from a Tbet-Cre mouse expressing GCaMP6f, showing a group of sister sTCs innervating the same glomerulus. Odorant was methyl valerate. Scale bar = 50 μm. F, ITA response traces from the sTCs shown in E, along with the glomerular signal (GL). Traces shown at right are normalized to their peak response to illustrate diversity in inhalation-linked rise times, and durations. Vertical dashed lines indicate inhalation onset. G, Dot plots showing the distribution of onset latencies for sister PG cells (left) or sTCs (right) associated with the same glomerulus, referenced to the latency measured from the neuropil of the parent glomerulus (blue vertical line). Each row is a different glomerulus. Black horizontal line spans the interquartile range and the black asterisk is the median. H, Same analysis in G but for time to peak for the same cells and glomeruli.

