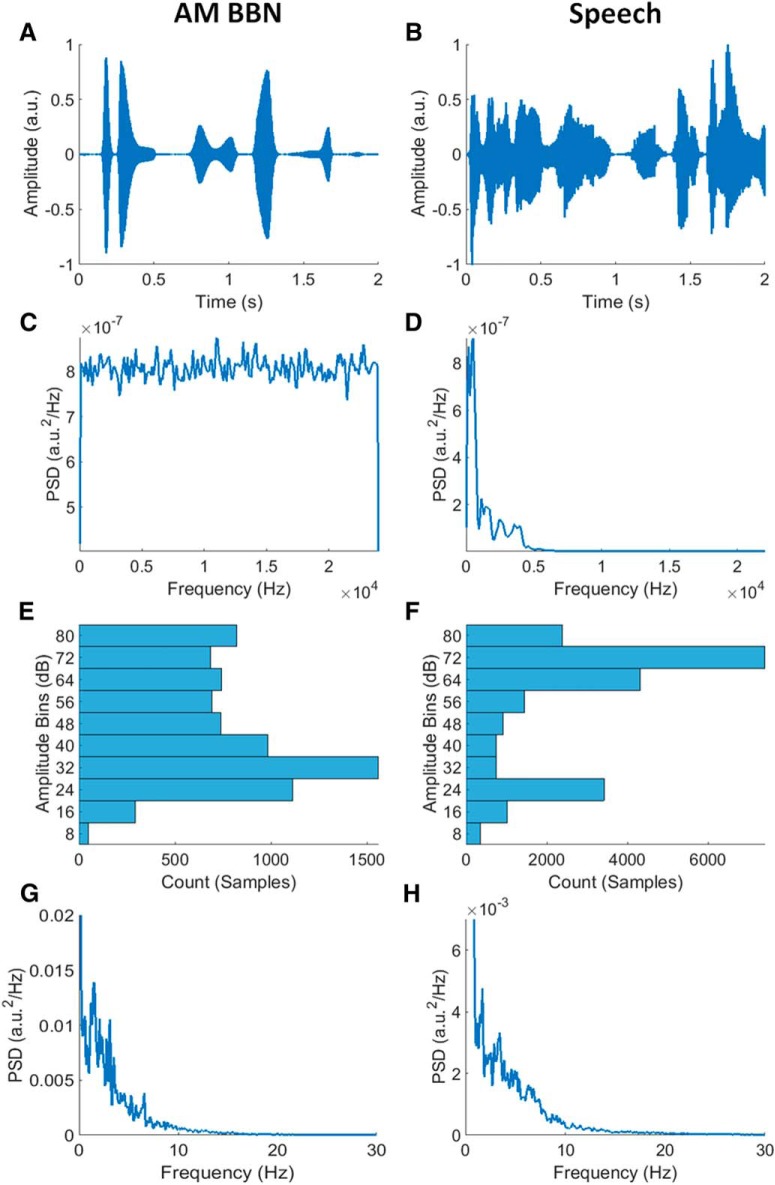
Figure 1.
A, B, Example segments of AM BBN and speech stimuli, respectively. C, D, Power spectral densities (PSDs) of AM BBN and speech stimuli, respectively. The AM BBN had a broadband frequency distribution by design, while the male speaker had a frequency distribution that was dominated by frequencies below 5000 Hz. E, F, Amplitude histograms of AM BBN and speech envelopes, respectively. Both envelopes had quite broadly distributed amplitude distributions. Please note that the amplitude distribution of the AM BBN envelope was uniform by design, but after extracting the envelope from the AM BBN signal using the Hilbert transform, it was less so. Also note that the amplitude distribution of the speech envelope was more skewed, with a higher percentage of samples in the higher amplitude bins. G, H, PSDs of AM BBN and speech envelopes, respectively. Both signals had envelopes with a bottom-heavy (right-skewed) frequency distribution indicating that their modulation rates were dominated by low frequencies.

