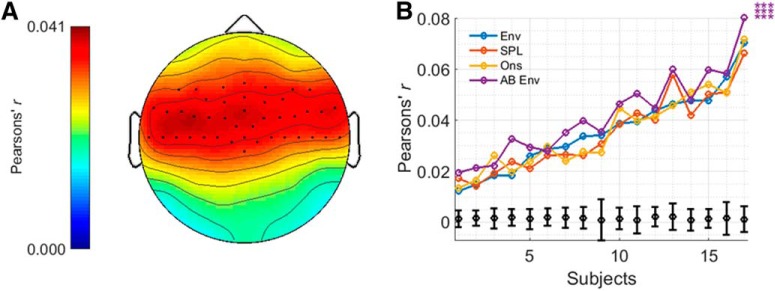
Figure 5.
A, Topographic plot displaying prediction accuracies for the envelope model for the speech dataset and highlighting the channels chosen for analysis. B, Prediction accuracies for each model and subject, including null hypotheses for the envelope model as determined from the permutation tests (in black), and indications of significance as determined from the t tests. Top, middle and bottom rows of asterisks indicate comparisons between AB Env and Env, SPL, and Ons, respectively. ***p < 0.001, **p < 0.01, *p < 0.05.

