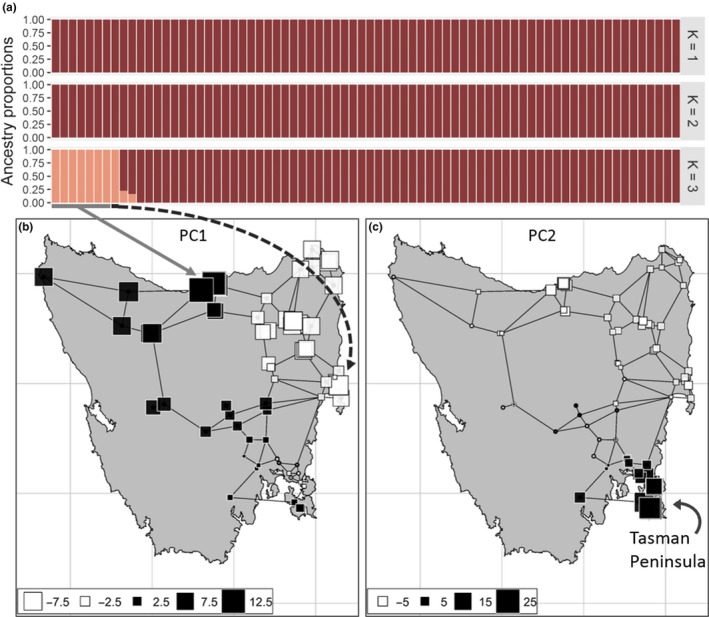
Figure 3.

fastSTRUCTURE (a) and spatial principal component (sPCA) (b and c) results for Tasmanian individuals. Spatial mapping of the principal components 1 (b) and 2 (c) of the sPCA visually represents genetic differentiation proportional to difference in square size and shade. Arrows designate where the eight individuals assigned to the separate cluster (>99% ancestry proportion; a) are geographically located
