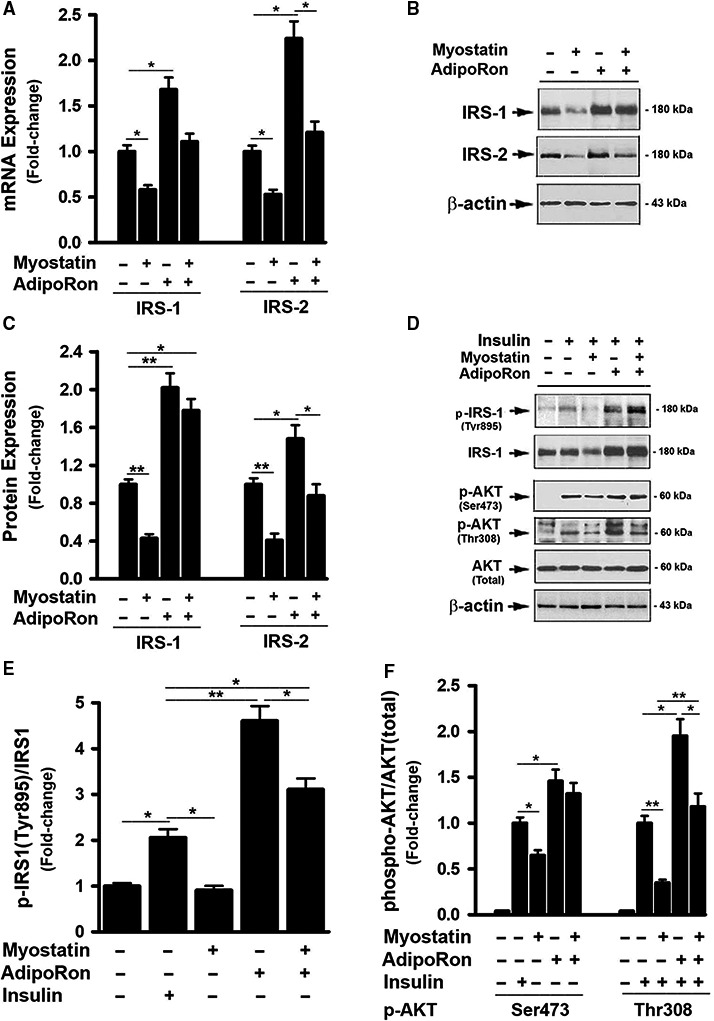
Figure 2.

AdipoRon protected against myostatin‐induced insulin resistance. (A) FL83B cells were treated with either vehicle or myostatin (100 ng/mL), or AdipoRon (20 μmol/L) for 2d, total RNA was isolated and subjected to Rt‐PCR analysis. (B) Cells treated with either vehicle or myostatin (100 ng/mL), or AdipoRon (20 μmol/L) for 3d. Total cell lysates were prepared and subjected to western blotting. (C) Blots in B were quantified by scanning densitometry and the ratio of IRS‐1 or IRS‐2 to β‐actin was calculated and is shown as fold of change. (D) Cells were pretreated with either vehicle or myostatin (100 ng/mL), or AdipoRon (20 μmol/L) for 3d, followed by the treatment with insulin (100 nmol/L) for 30 min. Total cell lysates were prepared and subjected to western blotting. (E) Blots in D (panels 1 & 2 from top) were quantified by scanning densitometry and the ratio of phosphor‐IRS1 (Tyr895) to endogenous IRS1 was calculated and is shown as fold of change. (F) Blots in D (panels 3, 4, 5 from top) were quantified by scanning densitometry and the ratio of phosphor‐AKT (Ser473) or phosphor‐AKT (Thr308) to endogenous AKT was calculated and is shown as fold of change. Data shown in B and D are representative Western blot analysis; Data shown in A, C, E, F are mean values ± SEM from three separate determinations; *P < 0.05; **P < 0.01 compared to vehicle‐treated cells.
