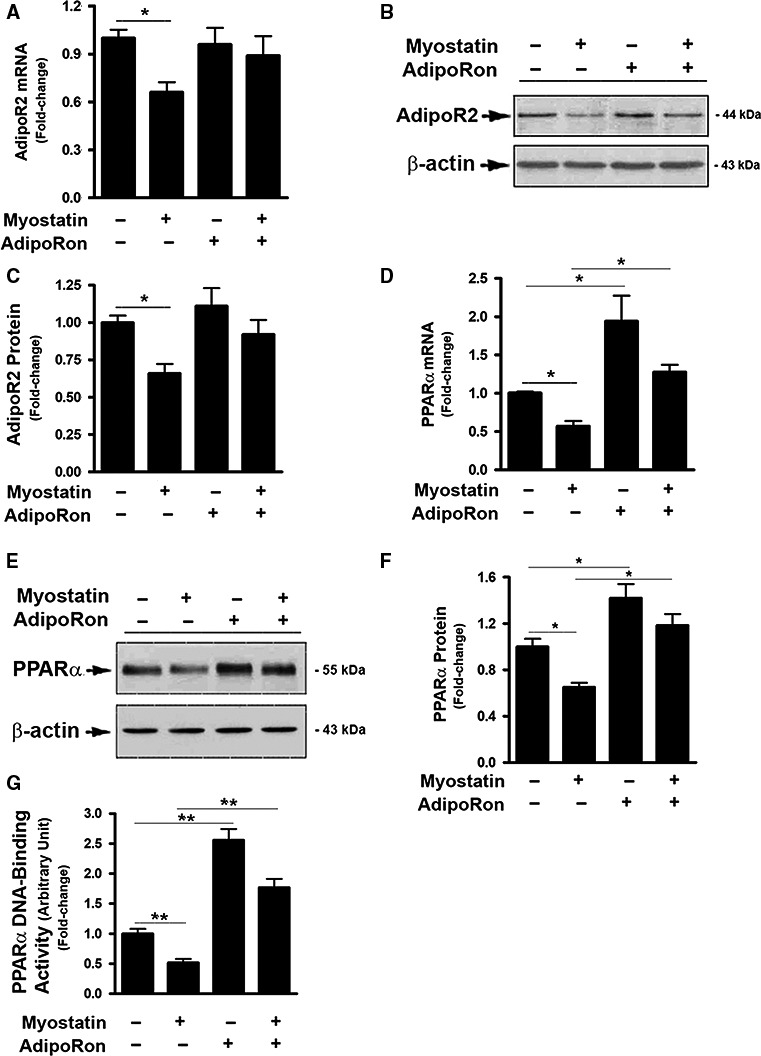
Figure 4.

AdipoRon prevented myostatin‐induced inhibition of AdipoR2 activity. (A, D) FL83B cells were treated with either vehicle or myostatin (100 ng/mL), or AdipoRon (20 μmol/L) for 2d, total RNA was isolated and subjected to Rt‐PCR analysis. (B, E) Cells were treated with either vehicle or myostatin (100 ng/mL), or AdipoRon (20 μmol/L) for 3d. Total cell lysates were prepared and subjected to western blotting. Blots in B and E were quantified by scanning densitometry and the ratio of AdipoR2 to β‐actin (C) or PPAR α to β‐actin (F) was calculated and is shown as fold of change. (G) Cells were treated with either vehicle or myostatin (100 ng/mL), or AdipoRon (20 μmol/L) for 3d. Nuclear protein was prepared and subject to DNA‐binding assay. Data shown in B and E are representative Western blot analysis. Data shown in A, C, D, F, G are mean values ± SEM from three separate determinations; *P < 0.05; **P < 0.01 compared to vehicle‐treated cells.
