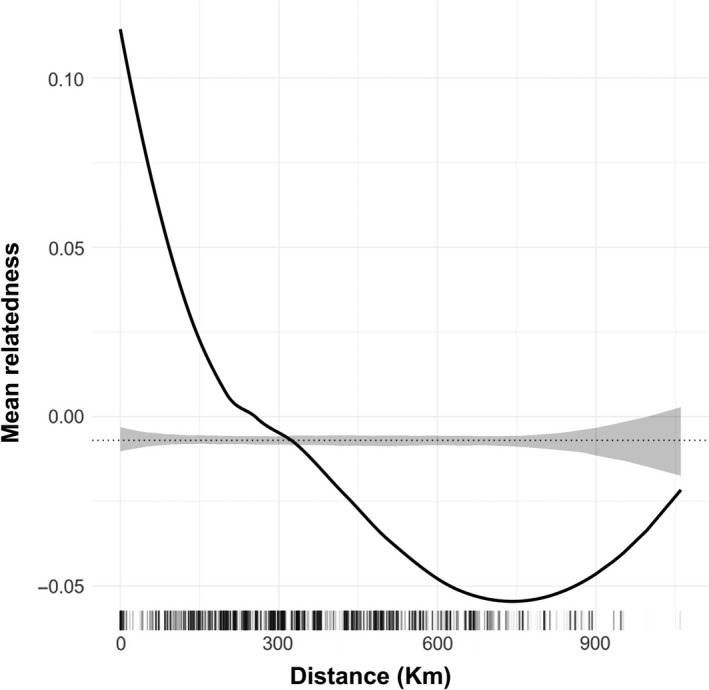
Figure 3.

Spatial autocorrelation in genetic relatedness. The black solid line is the LOESS fit to the observed genetic relatedness, while the gray shaded regions are 95% confidence bounds around the null expectation (black dotted line). Short vertical lines at the bottom of the figure are observed pairwise distances
