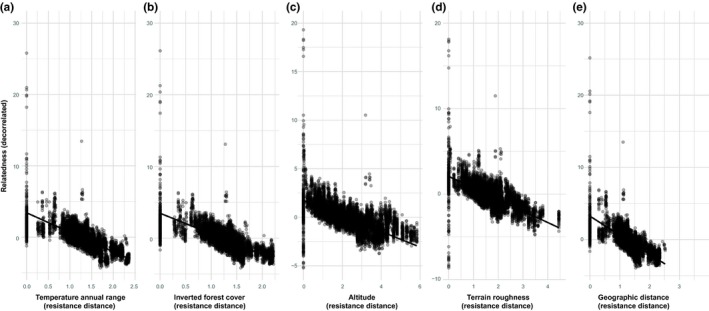
Figure 4.

Isolation‐by‐resistance effects across the entire distribution range of Melipona subnitida. Plots show the relationship between genetic relatedness and temperature annual range (a), inverted forest cover (b), altitude (c), terrain roughness (d), and geographic distance (e). Although the isolation by geographic distance was not among the top models, we include it here for comparison. Relatedness is decorrelated for the MLPE correlation structure
