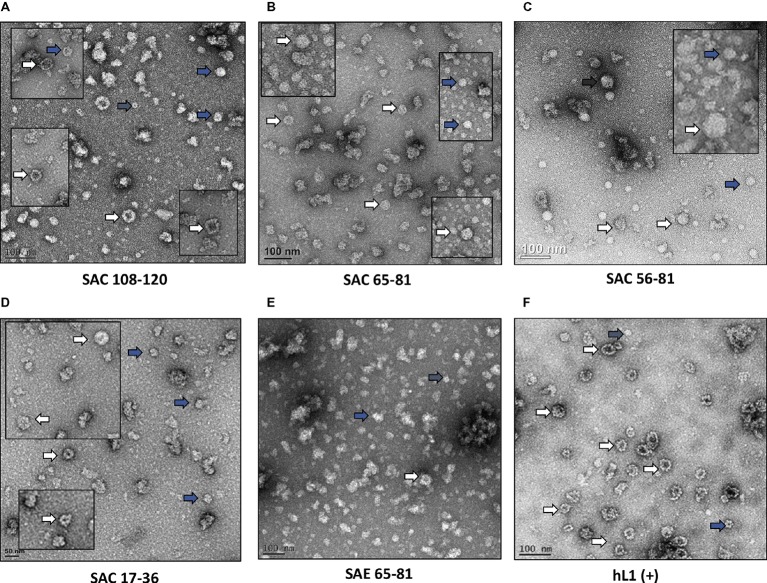
Figure 2.
Transmission electron micrographs of purified cVLPs. Purification of cVLPs in a high-salt, low-pH buffer, followed by ultracentrifugation on a discontinuous Optiprep™ gradient. (A) SAC 108-120, (B) SAC 65-81, (C) SAC 56-81, (D) SAC 17-36, (E) SAE 65-81, and (F) HPV-16 hL1. Labels: white arrows, cVLPs 50–60 nm; blue arrows, small cVLPs 25–40 nm; grey arrows, capsomeres ~10 nm. Scale bar indicated at the bottom left of each image.

