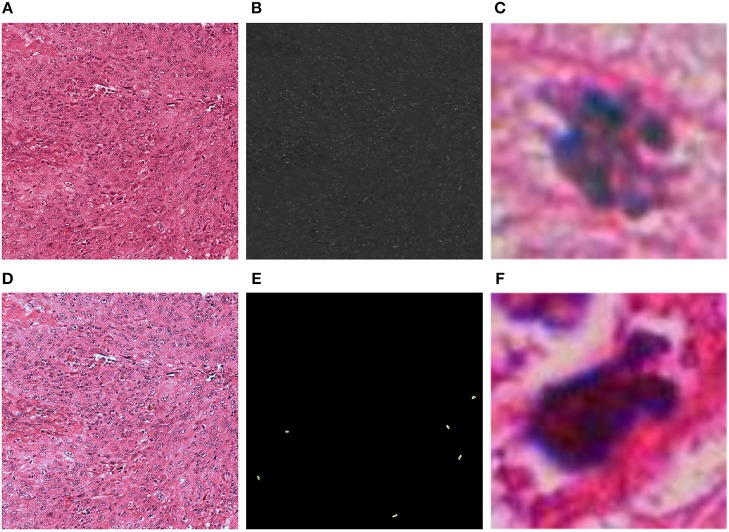
Figure 1.
Results of the color normalization algorithm and blue ratio image generation for one frame: (A) Original HPF; (B) Blue ratio (BR) image; (C) Mitotic 71 × 71 patch generated with the thresholded version of the BR image; (D) Color normalized HPF; (E) Detection of mitosis centroids using the BR image to validate true positive rate; (F) Non-mitotic 71 × 71 patch generated with the thresholded version of the BR image.

